A higher conversion rate can still be a bad business decision. It may attract customers who cancel sooner, increase refunds, create support work, or produce smaller orders. The dashboard can call the variant a winner while finance absorbs the damage later.
A useful system of A/B testing metrics starts with a stricter rule. Every test needs one decision metric, a small set of risk metrics, and an evaluation window that matches the customer journey. Conversion rate may be the right primary metric for one test, while settled revenue, retention, or payback period governs another.
That discipline matters because operators often compare conflicting numbers across analytics, CRM, billing, and finance systems. A semantic layer gives those teams a shared business definition, so “revenue,” “customer,” and “retained” mean the same thing wherever a question is asked. It's not another dashboard. It's the agreement that makes dashboards and plain-English answers trustworthy.
A 2025 survey of 402 marketing professionals who actively run A/B tests found that retention rate ranked as the most important evaluation metric for 46% of respondents, narrowly ahead of conversion rate at 45%. Click-through rate accounted for 41%, and time on site for 36%, showing why mature teams look beyond one top-line measure (Ascend2's 2025 A/B testing research). Before you launch, use proven A/B test templates to define the decision, risks, and evidence you'll accept.
Table of Contents
- 1. Conversion Rate
- 2. Revenue Per Visitor
- 3. Statistical Significance
- 4. Customer Acquisition Cost Payback Period
- 5. Click-Through Rate and Engagement Metrics
- 6. Funnel Completion Rate and Drop-Off Analysis
- 7. Customer Lifetime Value and Retention Rate
- 8. Relative Uplift and Relative Confidence Interval
- 8-Key A/B Testing Metrics Comparison
- Choose the Metric Before You Trust the Win
1. Conversion Rate
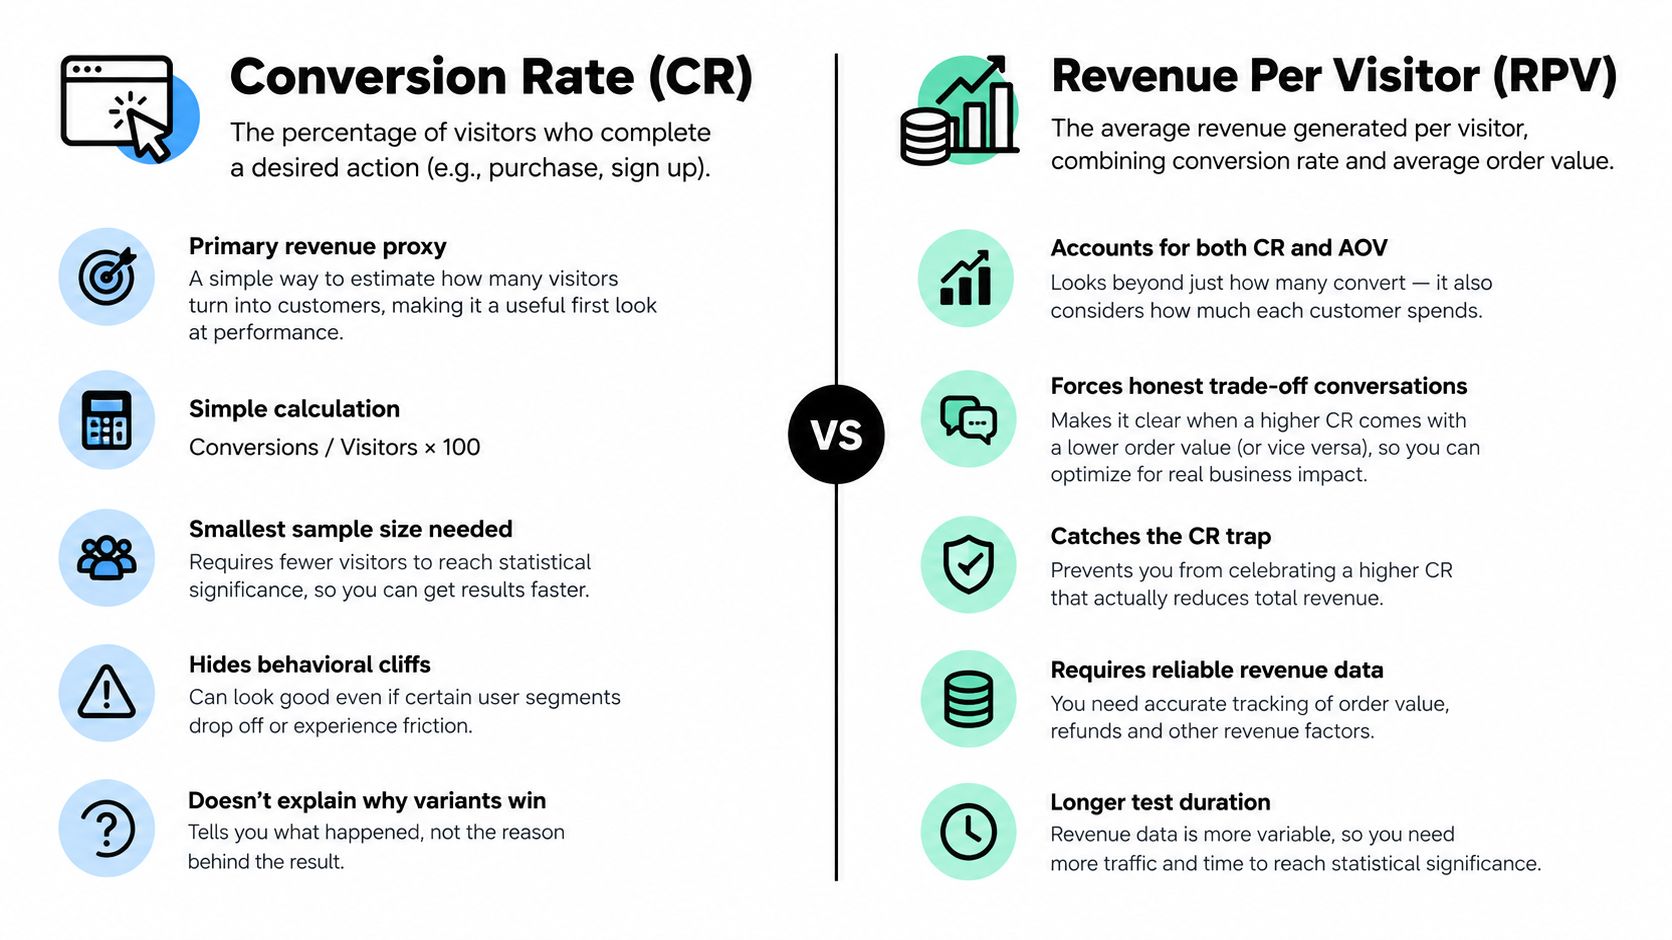
Conversion rate is the obvious starting point, but it isn't the final verdict. It measures the share of users who complete a defined action, such as purchasing, starting a trial, booking a demo, or submitting a form. Use it as the primary metric when the experiment is directly intended to increase that action and the action has a clear commercial connection.
For a small company, conversion rate answers an immediate resource question: does this change justify engineering, design, or campaign effort? If a checkout revision increases completed purchases without damaging order value, customer quality, or operational cost, the evidence is useful. If it only increases low-intent signups, the number is incomplete.
Segment the result before calling a winner. A variant can perform differently for paid and organic visitors, new and returning users, mobile and desktop traffic, or different customer types. An aggregate result can hide a serious quality problem when one high-volume segment compensates for a weak segment that matters more to the business.

Use conversion rate diagnostically
Pair the headline number with the funnel events that lead to it. Add-to-cart activity, form starts, verification, activation, and payment completion can show whether the variant improved the whole path or merely moved users into a later failure point.
Don't peek at an early result and declare victory. Decide the evaluation window and stopping rule before launch. The Convert guide to running A/B tests also highlights the need to define a practical lift threshold before the experiment begins. Statistical positivity isn't enough if the improvement is too small to matter economically.
Practical rule: Conversion rate earns the rollout only when the action represents valuable demand and the guardrails remain inside their agreed limits.
2. Revenue Per Visitor
Revenue per visitor, or RPV, is often a better primary metric than conversion rate for e-commerce and monetized SaaS journeys. It connects total revenue to the visitor population, so it captures both how many people buy and how much value each visitor generates.
That distinction prevents a common mistake. A variant can increase the number of buyers by pushing discounts, cheaper plans, or low-value offers while reducing the revenue produced by each visitor. Conversion rate reports progress. RPV tells you whether the traffic is producing commercially useful outcomes.
Use settled revenue rather than gross bookings when the business can experience refunds, chargebacks, cancellations, or delayed payment. Otherwise, the experiment may receive credit for revenue that never becomes cash. The metric definition must also specify attribution, currency treatment, timing, and whether repeat purchases belong inside the test window.

Separate the levers behind RPV
Report RPV beside conversion rate and average order value. Those supporting measures explain whether the variant wins through more buyers, larger baskets, or a mixture of both. They also expose fragile wins, such as higher RPV driven by a small number of unusually large transactions.
Revenue metrics usually need a longer evaluation window than a click or signup. Weekend and weekday purchasing patterns, returning-customer mix, refunds, and delayed invoices can change the result after the initial excitement fades. The right window is the time required for the revenue definition to stabilize, not the time required to fill a dashboard.
A pricing page test illustrates the trade-off. If more visitors start a lower-priced plan, conversion can rise while RPV falls. The correct decision depends on the company's objective, acquisition economics, retention outlook, and capacity to serve the additional customers. RPV makes that trade-off visible instead of hiding it behind a single action rate.
3. Statistical Significance
Statistical significance is evidence about whether the observed difference is distinguishable from random variation. It isn't a business case, a guarantee of repeatability, or permission to stop watching the customer after rollout.
The right question isn't “Did the dashboard turn green?” It's “Did we make the decision under a pre-agreed method, with trustworthy assignment, a defined primary metric, and an evaluation window that reflects the outcome?” A test can show an impressive lift and still be invalid if traffic was misallocated, tracking changed, or the team repeatedly checked results until something appeared positive.
Data integrity comes first. Sample ratio mismatch, where the observed allocation differs from the intended allocation, can invalidate the result even when the headline conversion number looks strong. Biased event logging creates the same problem. A missing purchase event in one experience is not a small reporting inconvenience. It changes the experiment's evidence.
Treat confidence as a boundary
Report the estimated effect with its confidence interval, not confidence language alone. A narrow interval supports a more precise decision. A wide interval says the team hasn't learned enough to distinguish a useful improvement from a trivial one or a decline.
Experimentation is concentrated among larger traffic properties. BuiltWith-based reporting estimates that roughly 2.2 million websites use A/B testing or experimentation platforms, while adoption reaches about 32% among the top 10,000 sites, 20.95% among the top 100,000, and about 11.5% across the top 1 million websites. The same reporting says 70% of completed tests are run at 95% or higher statistical confidence, nearly half at 99% or higher, while 60% deliver under 20% lift and 84% under 50% lift (Convert's A/B testing statistics). The operational lesson is clear: rigorous programs usually produce modest, decision-grade gains.
Don't inflate certainty by checking too many metrics or repeatedly peeking. Choose the primary metric and decision threshold before launch. When traffic is limited, label the result exploratory and validate it rather than dressing weak evidence up as certainty.
4. Customer Acquisition Cost Payback Period
Customer acquisition cost payback period measures how long it takes for the contribution from a new customer to recover the fully loaded cost of acquiring that customer. It separates sustainable growth from growth that consumes cash faster than the company can replenish it.
A conversion lift has no automatic value. If a variant produces more customers but those customers require heavier sales support, use more discounts, or churn earlier, payback can worsen. The test should therefore connect the experience change to acquisition cost, collected revenue, gross margin where relevant, and customer quality.
Calculate payback by channel and cohort. Organic, paid, partner, and outbound customers often have different costs and behavior. An aggregate result can make a variant look healthy because a low-cost channel offsets deterioration in an expensive one.
Make the cost definition complete
Include salaries, software, agency fees, sales support, and relevant overhead in the acquisition definition. Counting only advertising spend produces an artificially attractive result and gives leadership the wrong rollout signal.
Set the maximum acceptable payback before the experiment. The threshold belongs to the company's cash position and operating model, not to the test dashboard. A variant that increases conversion but crosses that boundary needs a different treatment, even if the primary metric is positive.
Review retention and lifetime value alongside payback. Faster recovery is not useful if customers disappear soon afterward. For a plain-language explanation of the metric and its business role, use this guide to payback period.
A test wins financially when it improves the path from acquisition cost to durable contribution, not when it produces the most attractive first-session percentage.
5. Click-Through Rate and Engagement Metrics
Click-through rate is a leading indicator. It measures whether users respond to a link, button, message, or call to action after seeing it. That makes it useful for diagnosing attention and intent, but dangerous as a standalone success metric.
A subject line can earn more clicks while sending less-qualified traffic into the funnel. An ad can create curiosity without producing customers. A product interface can increase interaction while making the next task harder. CTR tells you that behavior changed. It doesn't tell you whether the change improved the business.
Use engagement metrics to explain the primary result. Scroll depth can show whether users reach the relevant offer. Form starts can reveal interest before completion. Time on site can indicate attention, confusion, or difficulty. None of these measures carries meaning without the downstream action attached to it.
Keep leading indicators in their lane
Pair CTR with conversion, qualified lead rate, revenue, or activation. If clicks rise and downstream performance falls, the variant may be attracting the wrong audience or making a promise the destination doesn't fulfill. That's a quality warning, not a copywriting victory.
Segment by audience and device. Returning customers may respond differently from first-time visitors. Mobile users may click more readily but complete fewer complex forms. A variant that wins in the largest segment can still create an unacceptable experience for a commercially important group.
Use CTR for fast feedback on high-volume channels, then validate the business outcome over the proper lag. A marketing team can use it to decide which message deserves a deeper test. It shouldn't use it to justify permanent rollout when revenue or retention disagrees.
The same principle applies to engagement. More activity is valuable only when it represents progress toward the customer's intended outcome. If users spend longer because they can't find the price or complete checkout, engagement is measuring friction.
6. Funnel Completion Rate and Drop-Off Analysis
A funnel metric shows where users advance, hesitate, or leave across a sequence of actions. It answers the question conversion rate cannot: where did the experience change the outcome?
For a SaaS journey, that might include signup, verification, activation, first value, and payment. For e-commerce, it may include product view, cart, checkout start, payment, and completed order. For B2B, it can run from form start through qualification and sales acceptance. The exact stages depend on the business model, but each stage needs a stable definition.
Start with the bottleneck, not the most visible screen. Improving a late-stage button won't solve a major loss at the first meaningful step. A shorter form may increase completions while reducing the information sales needs. A guest checkout may increase purchases while changing the company's ability to build a repeat-customer relationship.
Diagnose the trade-off, don't average it away
Track both step completion and the final business outcome. A variant that moves more users through an early step but produces no improvement later may have shifted behavior without removing the underlying obstacle. A variant that lowers an early action but improves qualified revenue may be doing valuable filtering.
Cohorts matter because users don't always complete a journey in one session. Follow the same assigned population through the relevant period, rather than treating each event as an independent success. Late conversions, delayed activation, and sales qualification can change the interpretation.
For a broader explanation of how to connect steps and drop-offs, see this guide to funnel analysis.
A funnel report should help a founder decide where to invest effort next. If it merely lists percentages without identifying the commercial bottleneck, it's a decorative dashboard.
7. Customer Lifetime Value and Retention Rate
Short-term conversion is often the easiest metric to move and the easiest one to misuse. Retention rate and lifetime value reveal whether the customer remains valuable after the experiment's first interaction.
For subscription businesses, retention shows whether new customers continue using and paying for the product. For e-commerce, repeat purchase behavior provides a related quality signal. Lifetime value combines the expected economic contribution across the relationship, so it can expose a variant that buys initial volume by accepting customers who aren't a good fit.
Track early signals while the mature outcome develops. Activation, early product usage, first renewal, cancellation intent, refunds, and support contacts can help identify emerging damage. They're proxies, not replacements for the long-term outcome. A proxy becomes useful only when the company has evidence that it predicts the business result it stands in for.
Protect the baseline
Maintain a stable comparison point when the business can support it. Without a control reference, each new test can make the current experience look normal even as customer quality shifts over time. The comparison needs consistent definitions across product analytics, billing, and CRM.
Segment retention by acquisition source, plan, customer type, and cohort. A variant can improve the average by changing the mix of customers rather than improving the experience for each group. That's why retention should be read beside acquisition cost and revenue quality, not in isolation.
A pricing test that increases paid starts but brings in customers who cancel quickly may be negative for lifetime value. An onboarding change that reduces immediate conversion but improves activation and renewal may be the better investment. The correct primary metric depends on the decision the company is making.
For SaaS teams that need the concepts tied together, use this guide to customer lifetime value in SaaS. The reporting system should make the cohort story visible without forcing an operator to reconcile separate spreadsheets manually.
The 2025 survey cited earlier supports this broader view. Retention ranked ahead of conversion among respondents who actively run tests, a useful signal that experienced teams judge quality over time, not just the first action.
8. Relative Uplift and Relative Confidence Interval
Relative uplift explains the size of a change against the control. The confidence interval explains how uncertain that estimate is. You need both to distinguish a compelling result from a noisy headline.
Report absolute values as well. Saying that a conversion rate moved from one level to another gives executives the operating context. Saying that the variant delivered a relative improvement helps compare effects across metrics. Neither format should replace the other.
The interval matters because the observed uplift is an estimate, not a promise. A narrow interval around a modest effect can support rollout when the effect clears the company's practical threshold. A wide interval around a larger effect can require more evidence, especially when the downside would be expensive.
Set the threshold before the result
Define the smallest improvement worth implementing before the test begins. That threshold should reflect engineering cost, expected commercial value, customer risk, and the cost of being wrong. A statistically positive result below the practical threshold isn't automatically a win.
Use the same decision language across product, marketing, finance, and leadership. A useful report states the control value, variant value, absolute difference, relative uplift, confidence interval, primary decision, and guardrail status. It also names the evaluation window and any known data limitations.
Don't present a secondary metric as the winner because it has a more attractive percentage. Multiple checks create more opportunities for random positives, particularly when teams inspect results repeatedly or run many tests in parallel. The primary metric governs rollout. Secondary metrics explain the mechanism, and guardrails determine whether the business can accept the trade-off.
A company without a data team needs help when these definitions cannot be answered consistently. If finance uses settled revenue, marketing uses bookings, and product uses client-side events, the confidence interval is precise only for a disputed number. Metric trust is part of experiment quality.
8-Key A/B Testing Metrics Comparison
| Metric | 🔄 Complexity | ⚡ Resources / Time | 📊 Expected Impact | 💡 Ideal Use Cases | ⭐ Key Advantages |
|---|---|---|---|---|---|
| Conversion Rate (CR) | Low, simple binary event; needs consistent tagging | Low, fast signals; small sample sizes often sufficient | Directly maps to conversions/revenue; actionable | Quick A/B sanity checks; prioritizing immediate revenue moves | Clear business linkage; easy stakeholder buy-in |
| Revenue Per Visitor (RPV) | Medium, requires reliable revenue integration and settled revenue | High, high variance; needs longer runs (3–4x CR tests) | Captures CR and AOV; better bottom-line signal than CR alone | Pricing, bundling, monetization, founder/CFO decisions | Avoids CR-only traps; aligns with financial goals |
| Statistical Significance (Confidence Level) | Medium, sample-size planning; avoid peeking; choose power/alpha | Variable, noisy metrics need long durations; depends on baseline | Reduces false positives; provides defensible rollout evidence | Decisions requiring high confidence (board/large rollouts) | Quantifiable risk control; scalable framework |
| CAC Payback Period | High, requires full-cost attribution across channels/cohorts | High, backward-looking; months to observe payback | Predicts cash runway and scalability; ties tests to unit economics | Growth-budgeting, channel allocation, acquisition tests | Aligns experiments with sustainable growth; investor-relevant |
| CTR & Engagement Metrics | Low, click/impression instrumentation; pair with downstream events | Low, rapid feedback (24–48h) for high-traffic channels | Leading indicator of intent; may not translate to revenue directly | Ad/subject-line/copy/design experiments; early validation | Fast iteration cycles; easier stat significance |
| Funnel Completion Rate & Drop-off | Medium–High, multi-step instrumentation; cohort tracking needed | Medium, sample needs compound across steps; depends on funnel depth | Pinpoints where impact occurs; diagnostic for "why" lifts happen | Multi-step flows (signup, checkout, onboarding) and bottleneck fixes | Actionable step-level insight; prevents misdirected optimization |
| Customer LTV & Retention Rate | High, cohort analysis, attribution, and segmentation required | Very High, lagging metric; often needs 6–12+ months | Shows long-term profitability and hidden harms of variants | Retention, pricing, onboarding changes with long-term impact | Ensures sustainable growth; prioritizes customer quality |
| Relative Uplift & Confidence Interval | Medium, compute uplift and CI; baseline definition matters | Medium, CI width determines necessary runtime | Conveys effect size with uncertainty; informs rollout risk | Board reports, rollout criteria, comparing alternative effects | Interpretable effect + risk bounds; prevents misleading claims |
Choose the Metric Before You Trust the Win
Use a simple decision framework before approving any experiment. Name one primary business outcome, choose guardrails that expose quality or retention damage, report absolute values alongside relative uplift and confidence intervals, and match the evaluation window to the metric's lag.
The primary metric should answer the commercial question. Conversion rate works when the action represents valuable demand. RPV works when order value or monetization can move independently of purchase volume. Payback period matters when cash recovery governs growth. Retention and lifetime value should control decisions when the test can change customer quality over time.
Guardrails should reflect the ways the variant could hurt the business. Depending on the test, that may include refunds, cancellations, support volume, activation, error rate, qualified lead rate, or retention. Keep the set small enough to govern a decision. More metrics don't automatically create more insight. They can create more false positives and more arguments about which number counts.
Confidence intervals make the trade-off visible. A relative uplift without an interval encourages overconfidence. An absolute result without commercial context encourages poor prioritization. Leadership needs both the size of the observed change and the range of outcomes that could reasonably repeat.
Sample size and statistical power are judgment calls when traffic is limited. They're not reasons to manufacture certainty or to turn an exploratory result into a board-level fact. Label uncertainty, validate important winners, and use a holdout or follow-up measurement when the customer journey extends beyond the initial test.
A BI partner becomes necessary when metric definitions differ across systems, revenue or CRM data arrives late, cohorts can't be followed reliably, or leadership needs repeatable board reporting. Those are not dashboard-design problems. They're failures of shared business meaning and data lineage.
For companies with 20 to 200 employees and no data team, HelpWithMetrics offers a done-for-you agentic BI service at $5K per month flat, with a trustworthy semantic layer and AI-answerable reporting delivered in 30 days. That model can give founders, COOs, and RevOps leads governed experiment reporting without forcing an immediate full-time data hire. The service can connect core business sources, align definitions, and produce audit-ready dashboards for metrics such as conversion, revenue, retention, and test outcomes.
Book a call when your team spends more time reconciling A/B testing metrics than deciding what to ship. Ask for a free first dashboard and test whether your current winner survives a consistent definition across product, marketing, CRM, and finance.
HelpWithMetrics connects your core data sources into a managed semantic layer, so A/B test results use consistent definitions for conversion, revenue, retention, and customer value. Visit HelpWithMetrics to book a call and get your free first dashboard.