You're probably looking at three different CPL numbers right now and wondering which one you should take into the next budget meeting.
Marketing says paid search is efficient. Sales says the leads are soft. RevOps says the CRM report doesn't match either story. The CEO grabs a screenshot from HubSpot, someone else exports a CSV from Google Ads, and suddenly a simple question turns into a debate about whose dashboard is “right.”
That's the wrong debate. Cost per lead calculation is easy. Trustworthy cost per lead calculation is hard. Anyone can divide spend by leads. The work is deciding what counts as spend, what counts as a lead, and which systems get to define reality. If you don't settle those definitions first, your first data hire won't fix the confusion. They'll inherit it.
Table of Contents
- The Three Dashboards Telling You Different Numbers
- The Formula and the Two Decisions That Actually Move It
- What Belongs in the Numerator Beyond Ad Spend
- Why Raw Form Fills Are a Trap for MQL-Heavy Teams
- Benchmarks by Channel and the Attribution Pitfalls Between Them
- How Trustworthy CPL Changes Hiring and Budget Decisions
- Getting One Number Everyone Agrees On
The Three Dashboards Telling You Different Numbers
Monday morning. The VP of Marketing says Google Ads is delivering an efficient CPL. RevOps says blended CPL is much higher once organic, paid social, and content costs are included. The CEO pulls a HubSpot report showing a third number that doesn't match either one.
All three can be technically correct.
Google Ads is usually reporting platform spend against platform conversions. HubSpot is often counting a broader set of contacts. RevOps may be trying to blend costs across channels and tie them to a different lead stage. Same acronym. Different numerator. Different denominator. Different attribution window.
Why the math isn't the problem
The formula isn't where operators get stuck. The disagreement starts earlier.
A dashboard can show a low CPL because it only counts ad spend. Another can show a higher CPL because it includes salaries, content, and software. A third can split the difference because it counts only certain lead sources or uses a different attribution model. If your team is trying to optimize ads across Meta and TikTok, this problem gets worse fast because each platform reports success in its own preferred language.
Practical rule: If two dashboards disagree on CPL, assume definitions broke before the formula did.
What conflicting CPL usually means
When founders tell me they “need better reporting,” they usually mean one of these things:
- Spend isn't defined consistently. Media cost is in one report, agency fees are in another, and payroll is nowhere.
- Lead stages are mixed together. Demo requests, webinar signups, gated content downloads, and recycled contacts all end up in one bucket.
- Attribution rules change by tool. Last-click in one system rarely matches CRM source logic in another.
- Data joins are brittle. UTM fields go missing, contact records get overwritten, and source values drift over time.
That's not a dashboard problem. It's a data definition problem, and it shows up exactly the way broader data integration challenges across systems are experienced.
The practical consequence is simple. You can't run a clean budget review when each function is arguing from a different reality. You also can't justify a first analytics hire if the business hasn't agreed on the metric definitions that hire would be expected to report.
The Formula and the Two Decisions That Actually Move It
Your paid dashboard says CPL is fine. Finance says it is inflated. Sales says the leads were junk. The formula is not the problem. The inputs are.
At the concept level, cost per lead calculation is simple: total acquisition spend divided by total qualified leads in a defined period. Operationally, two decisions determine whether that number can survive a budget review. First, what counts as a lead. Second, which spend period you match to it.
Decision one is what you call a lead
Many B2B teams we review collapse inquiry, MQL, and sales-accepted lead into one label. That turns CPL into a cosmetic metric.
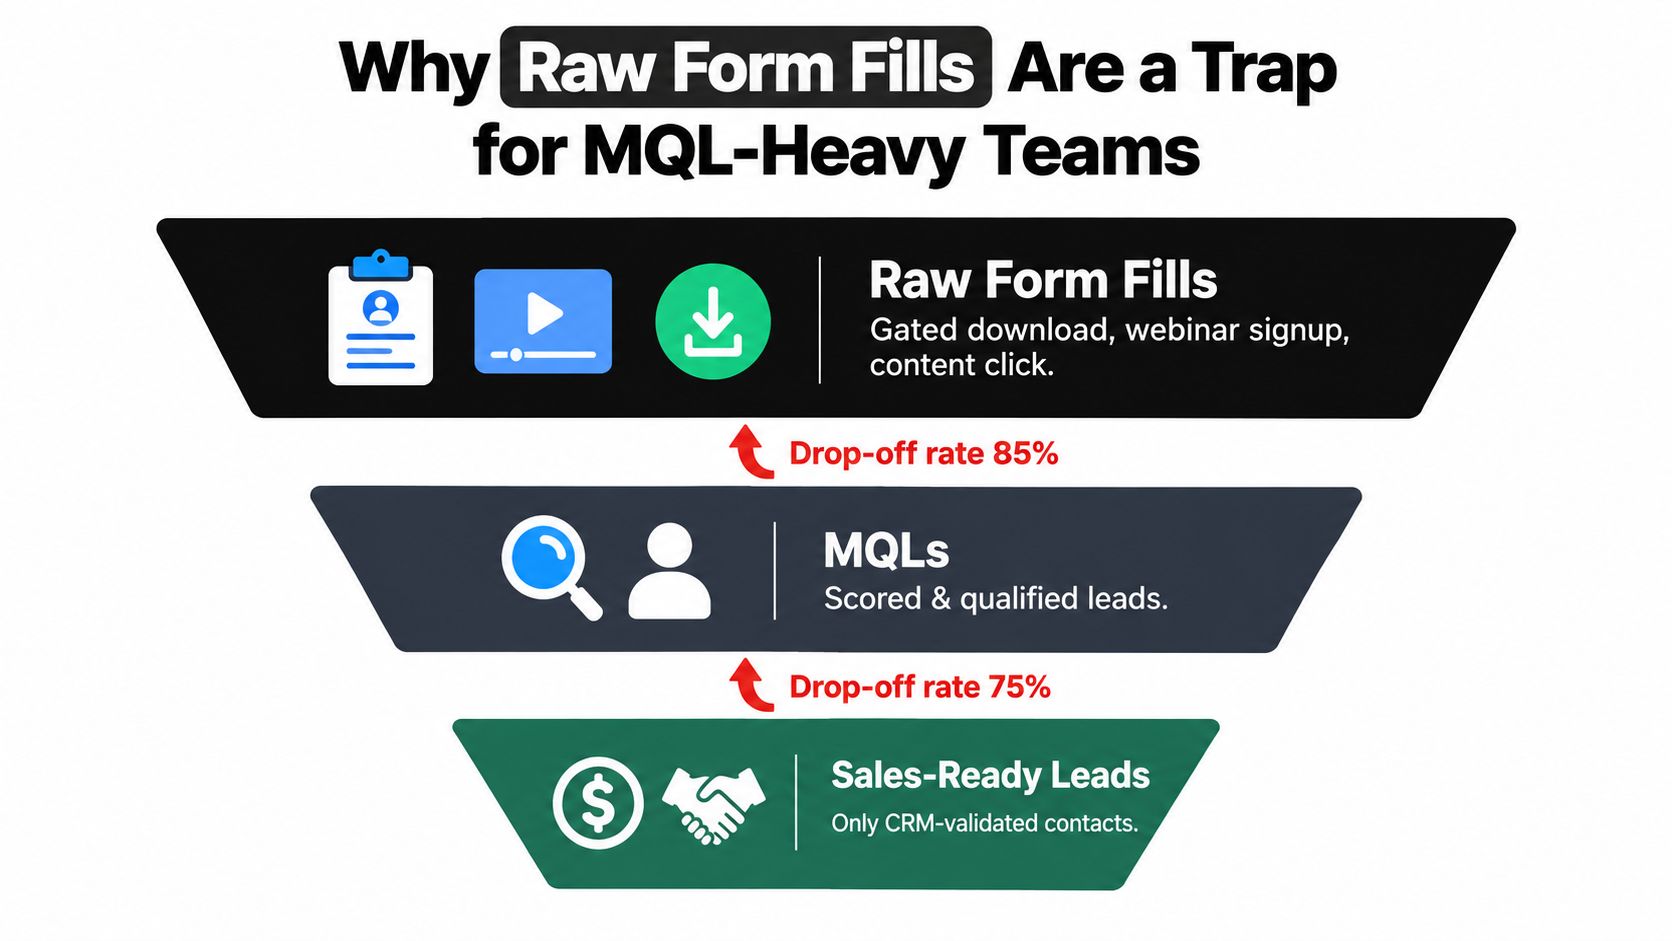
A raw form fill is an activity. An MQL is a screened contact. A sales-accepted lead has cleared a higher bar. Those stages are not interchangeable, and the denominator changes sharply depending on which one you use. If marketing reports CPL on form fills while leadership thinks it means qualified pipeline input, the metric will overstate efficiency every time.
External benchmark ranges often conflict for exactly this reason. One source counts any lead capture. Another counts qualified leads only. Treat benchmark comparisons carefully unless the lead standard matches your own. Otherwise you are comparing stage volume, not acquisition efficiency.
Decision two is the spend window
Timing changes the answer more than channel managers like to admit.
If you match July spend to July form fills, you get one CPL. If you match July spend to leads that became qualified in August, you get another. If events, content production, or agency work show up in one month while lead qualification lags into the next, monthly CPL will swing hard unless you set a rule and keep it.
Cheap CPL from the wrong lead stage is worse than a high CPL from the right one. At least the expensive number is honest.
The practical recommendation is blunt. Pick one lead stage for executive reporting, then pick one time-window rule that finance, marketing, and sales all accept. Keep both fixed long enough to make trend lines worth reading.
If you want a useful contrast between lead math and revenue-outcome math, this guide on how to calculate cost per acquisition helps because it forces the same underlying question: what outcome are you buying?
After you fix the definition problem, tactical optimization matters. These proven CPL reduction methods are directionally useful. Do not optimize a broken denominator. That is how B2B teams get faster at producing misleading reports.
What Belongs in the Numerator Beyond Ad Spend
Ad-spend-only CPL is a vanity metric. It flatters channel managers and misleads leadership.
A common gap in CPL reporting is that teams still define the numerator as media spend alone. More recent guidance is stricter. Fully loaded marketing spend should include labor, software, content, events, and data costs, with a matched time period between numerator and denominator, as outlined in La Growth Machine's CPL breakdown.
The numerator has to reflect reality
If LinkedIn media spend sits in one dashboard and everything else required to make that channel work lives somewhere else, the reported CPL is incomplete on arrival.
Here's what belongs in the numerator when you want a number finance won't laugh at:
| Cost Component | Ad-Spend-Only CPL | Fully-Loaded CPL |
|---|---|---|
| Media spend | Included | Included |
| Agency or freelancer fees | Excluded | Included |
| Demand gen labor | Excluded | Included |
| Attribution and reporting tools | Excluded | Included |
| Creative and content production | Excluded | Included |
| Event and sponsorship costs tied to lead gen | Excluded | Included |
This isn't accounting theater. It changes actual decisions.
What gets left out most often
The costs teams forget are usually the ones that make the campaign possible:
- People costs: The demand gen lead, paid media contractor, lifecycle marketer, or marketing ops support.
- Tooling costs: HubSpot, enrichment tools, attribution software, form tools, scheduling tools, and reporting layers.
- Production costs: Landing page copy, ad creative, webinar production, and content offers.
- Offline spend: Events, sponsorships, and partner placements that don't fit neatly inside ad platform reporting.
A founder who sees low ad-platform CPL often concludes the channel is working and should scale. A founder who sees fully loaded CPL asks the better question: is this channel still worth funding once all acquisition costs are counted?
Board-ready CPL should survive a finance review without anyone saying, “Yes, but that excludes the team and tooling.”
Once you load the full numerator, channel comparisons get less emotional. You stop arguing about which source looks cheapest in-platform and start asking which one earns the right to more budget.
Why Raw Form Fills Are a Trap for MQL-Heavy Teams
They don't have a CPL problem. They have a junk lead classification problem.
When every form submission gets counted as a lead, the metric gets detached from buying intent. A gated ebook download, a webinar registration, and a “Talk to Sales” request can all land in the same CRM. They should not carry the same weight in your cost per lead calculation.
Why this fools leadership so often
Raw lead volume creates a comforting story. The dashboard goes up and to the right. The cost per lead looks low. The campaign owner sounds efficient.
Then sales starts ignoring the queue.
What happened? Marketing optimized for the easiest conversion event available. Paid social is especially good at generating inexpensive hand-raisers when the form friction is low and the offer is broad. That doesn't mean those contacts belong in the same bucket as people who entered with explicit purchase intent.
Here's the operational cost of counting everything:
- Sales wastes time: Reps spend energy sorting weak inquiries instead of working actual opportunities.
- Forecasts drift: Leadership assumes top-of-funnel volume will translate into pipeline at a rate that never materializes.
- Optimization gets corrupted: Ad platforms learn to find more of the cheapest form submitters, not more of the right buyers.
The qualification gate is the real denominator
The denominator should reflect the earliest stage your company trusts. For some teams that's MQL. For others it's sales-accepted lead. The exact stage matters less than consistency.
This short walkthrough is worth watching because it captures the gap between lead volume and lead value in a way most dashboards don't.
Leadership sometimes resists this filter because the headline number gets worse when you stop counting junk. Good. A worse number that reflects reality is more useful than a flattering number that hides pipeline problems.
Benchmarks by Channel and the Attribution Pitfalls Between Them
A blended CPL across all channels is nearly useless for operating decisions.
Search, SEO, email, paid social, and events behave differently. They attract different buyer intent, convert on different timelines, and pick up credit through different attribution mechanics. If you compress them into one average, you erase the information you need.
The benchmark range is wide for a reason
Channel-level benchmark data from 13,474 U.S. search advertising campaigns run between April 2025 and March 2026 found an overall Google Ads average CPL of $66.69 in 2026, down from $70.11 in 2025, which marked the first year-over-year decline in five years according to Alpha Lead's 2026 benchmark summary. The same benchmark set cited approximate ranges of $30 to $120 for SEO and organic content, $30 to $90 for email, $80 to $300+ for paid search and paid social, and $150 to $400+ for events in that source.
Those ranges are exactly why one blended number misleads operators.
| Channel | Typical CPL Range (USD) | Common Attribution Skew |
|---|---|---|
| SEO and organic content | $30 to $120 | Often under-credited because demand was created earlier and captured later |
| $30 to $90 | Can look artificially efficient because it harvests existing demand | |
| Paid search | $80 to $300+ | Often gets last-click credit for buyers already warmed by other channels |
| Paid social | $80 to $300+ | View-through windows and soft conversions can inflate perceived impact |
| Events | $150 to $400+ | Lead capture and opportunity creation often happen well after spend lands |
Why channel comparisons go wrong
A founder sees paid search beating events on CPL and concludes events should be cut. That might be correct. It might also be nonsense.
Search often captures demand that content, brand, or outbound created earlier. Events can look expensive because the spend hits now while qualification and opportunity creation happen later. Email usually looks cheap because it monetizes an audience you already paid to build.
If you're debating whether to fund outbound headcount alongside inbound channels, something like a Hire BDR model belongs in the same operating conversation. Not because BDRs should be measured by CPL in the exact same way, but because leadership needs one framework for comparing how different acquisition motions create qualified pipeline.
The benchmark you actually need
Across 8,500+ B2B and B2C companies in a Q1 2026 benchmark, the average CPL was $213.60, up 7.6% from $198.44 in 2025, and that same benchmark showed vertical variation including SaaS at $55.20 median, Financial Services at $79.40, Legal at $92.10, and Ecommerce at $28.40 according to this 2026 CPL benchmark roundup. Useful context, yes. Sufficient for management, no.
What operators need is segmented CPL plus a credible attribution model. If your reporting can't connect channel-level cost to lead quality across touches, you don't need another dashboard. You need a cleaner attribution foundation, and that's exactly why understanding what multi-touch attribution is supposed to solve matters before you trust any blended channel report.
How Trustworthy CPL Changes Hiring and Budget Decisions
Once the company agrees on one defensible CPL, a lot of downstream decisions stop feeling political.
Before that, they're all political.
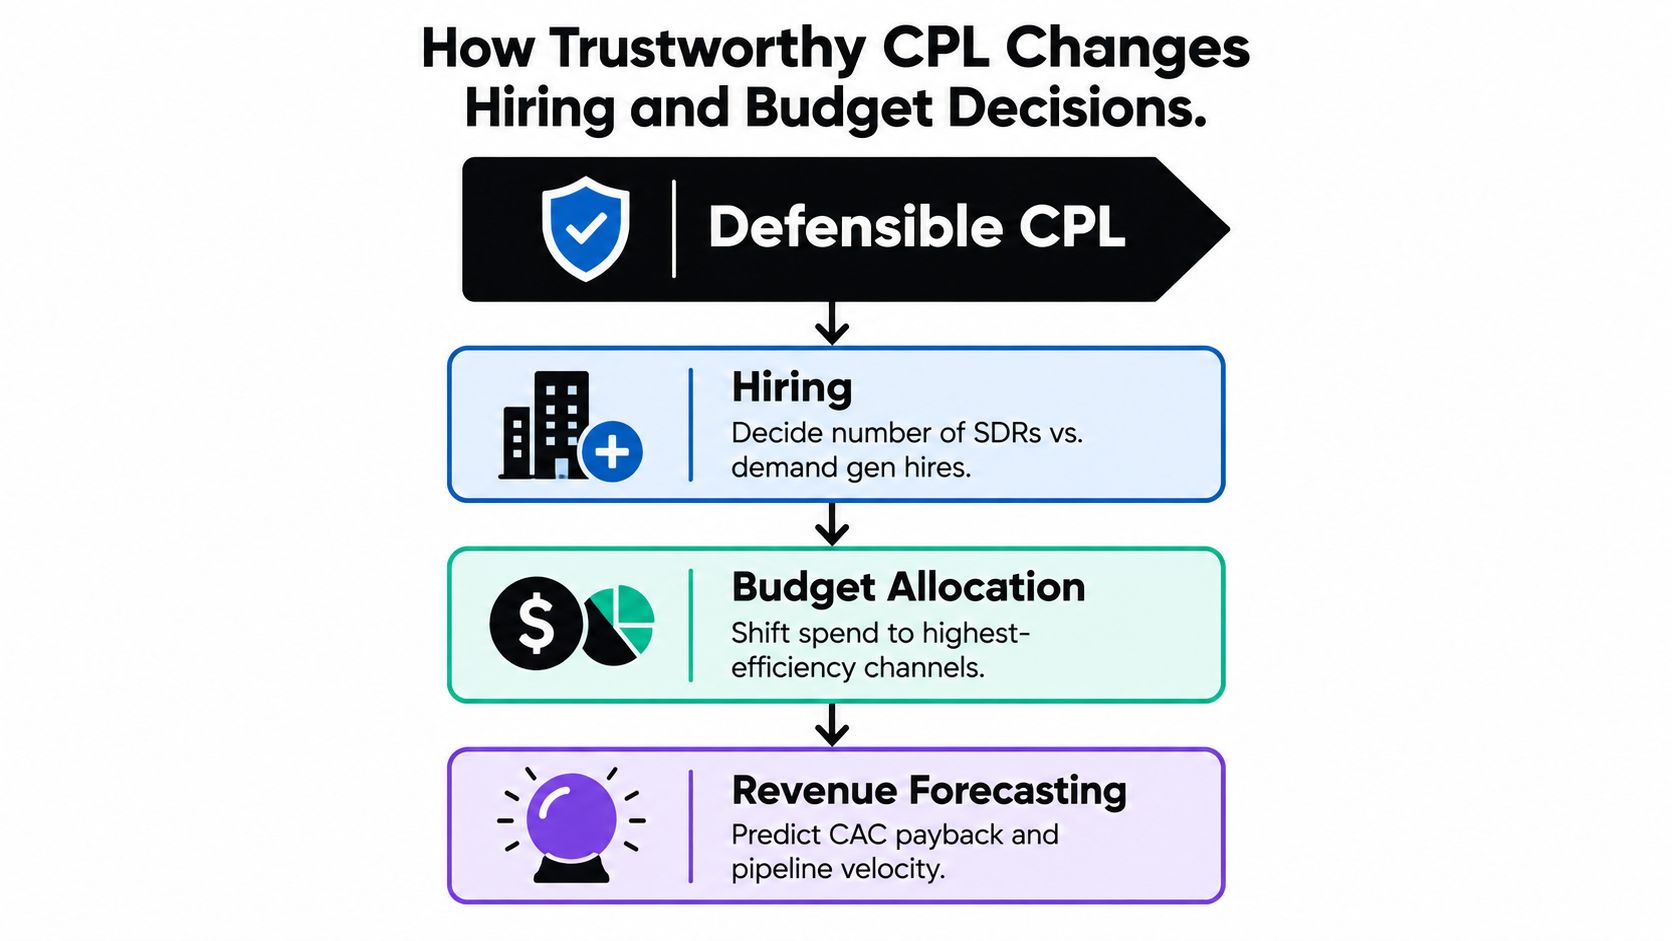
A clean CPL is governance infrastructure. It tells you how hard it is to manufacture pipeline. It sets the baseline for next quarter's budget. It also tells you whether the next hire should sit in paid media, RevOps, or data.
Hiring gets clearer fast
If your CPL is rising because channels are saturated, the answer might be a new demand gen operator. If CPL looks unstable because every report uses a different definition, hiring another media specialist won't help. You have a measurement problem, not a traffic problem.
This is why I'm skeptical when early-stage companies say they need a first data hire “to build dashboards.” Dashboards are the final layer. If leadership hasn't already agreed on spend policy, lead stage, and source logic, the new analyst becomes a referee in a semantic argument.
The first useful data function is not chart production. It's metric definition.
That's also why trustworthy CPL should exist before the first data hire, not as a deliverable from one. The hire should improve decision speed, not spend their first months negotiating what a lead is.
Budgeting stops being a spreadsheet fight
Without one agreed number, each channel owner argues in a different unit. Paid search wants more budget because platform CPL looks efficient. Content wants patience because assisted conversions don't show up in last-click reports. Events want exceptions because payback lands later.
With a defensible CPL, leadership can make cleaner calls:
- Set realistic lead targets: Marketing goals stop being divorced from spend reality.
- Pressure-test channel mix: High-CPL channels can still earn budget if they produce stronger qualified pipeline.
- Model payback more credibly: Finance gets a number that reflects actual acquisition effort, not just media invoices.
Tool, hire, or outsource becomes a business decision
Most companies in the awkward middle ask the same question in different words: should we buy another tool, hire internally, or use an outside partner?
A trustworthy CPL sharpens that choice.
If the metric problem is semantic, a new BI tool won't fix it. If the reporting burden is operational but the company lacks stable definitions, a full-time analyst is expensive risk. If leadership needs fast clarity and doesn't want to build a full data team yet, outside support often makes more sense because the business needs agreement and reliability first.
The point isn't that CPL decides everything. It's that nothing downstream gets decided well until CPL is believable.
Getting One Number Everyone Agrees On
Most founders think one reliable CPL number will appear after they buy a better BI tool or bring in a data person.
It won't.
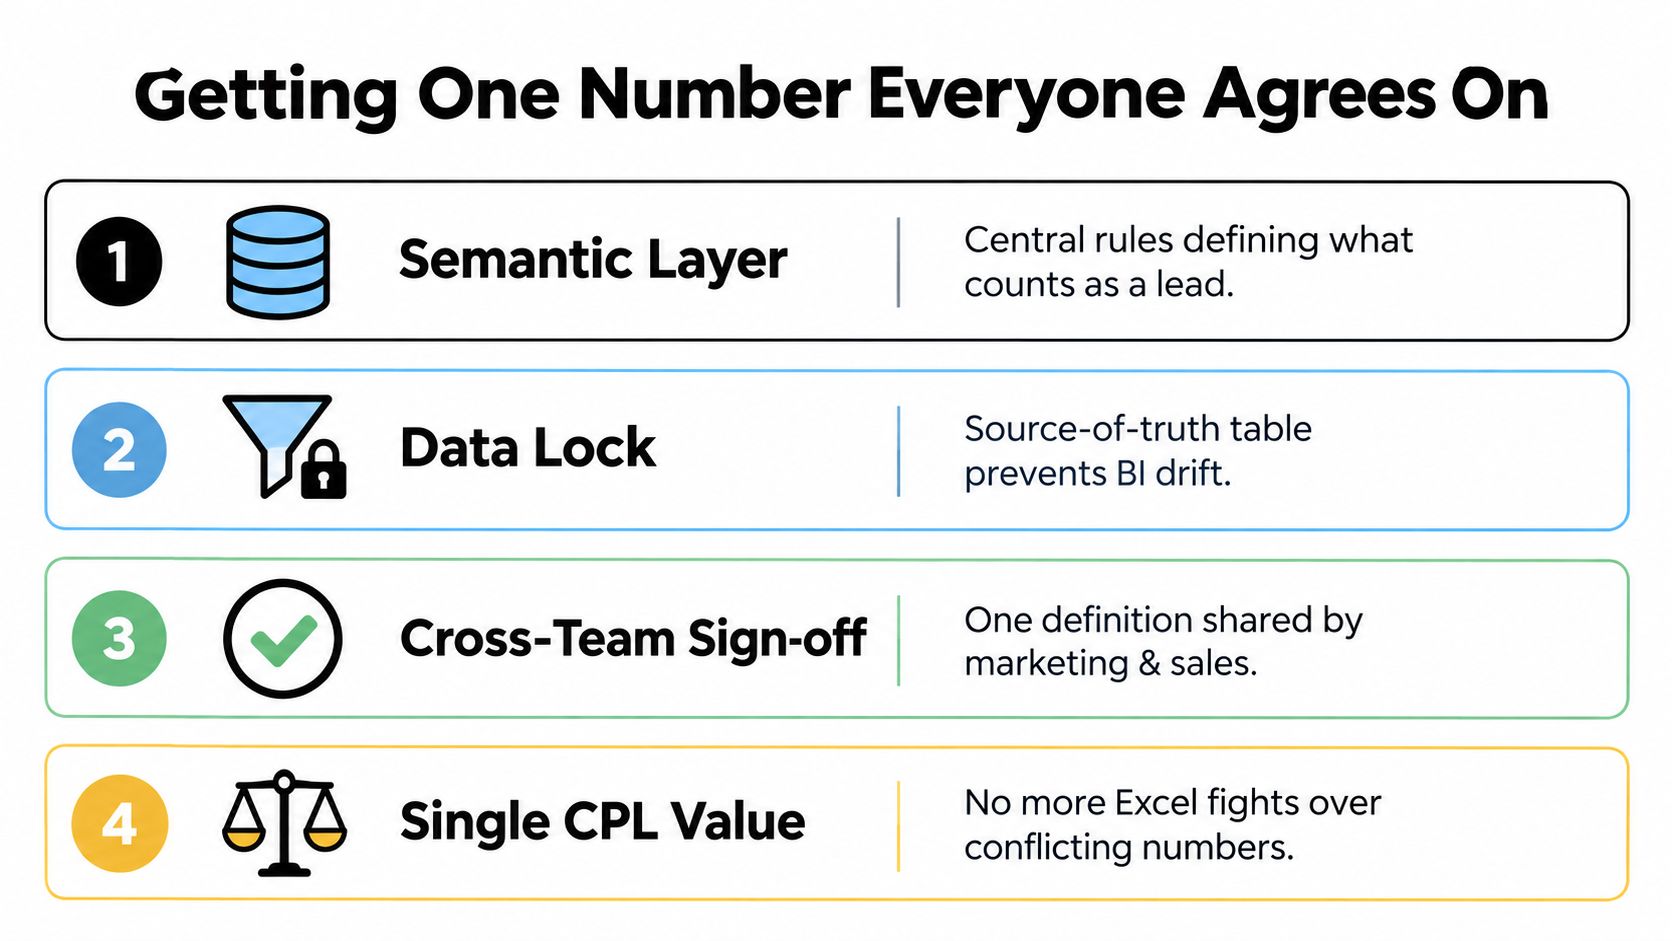
A trustworthy cost per lead calculation comes from a shared semantic layer. Not a fancy one. Just a strict, boring, cross-functional agreement about what counts as spend, what counts as a lead, and how records connect across systems. Without that agreement, every dashboard is just a prettier version of the same confusion.
The minimum viable agreement
You don't need a giant analytics transformation. You need three things locked down:
- A lead definition document: One written standard for the stage used in the denominator.
- A spend allocation policy: Clear rules for what gets included in acquisition cost and when.
- A durable join key: A stable way to connect source, spend, and lead outcome even when CRM fields drift.
That's the foundation. Tooling sits on top of it. Analysts work from it. Board reporting depends on it.
Why the usual fixes fail
Companies usually try one of three moves.
They buy another reporting tool. The tool still ingests conflicting definitions, so now the disagreement is just centralized.
They hire a data person. That person spends months reconciling systems and negotiating vocabulary instead of driving decisions.
They outsource reporting without first agreeing on business logic. The partner can ship charts quickly, but the charts still trigger arguments if source definitions remain unresolved.
If sales, marketing, finance, and RevOps haven't signed off on the denominator, your CPL isn't a metric. It's a recurring meeting.
The hard truth is that “one number everyone agrees on” isn't a software feature. It's an operating choice. Once leadership makes it, reporting gets faster, hiring gets easier, and budget reviews stop turning into dashboard theology.
A company that can't produce one trusted CPL should not be hiring a full-time analyst yet. It should be fixing the layer of business logic that analyst would otherwise spend their time untangling.
If your team is still debating which CPL number is real, that's the problem to solve first. HelpWithMetrics gives companies a done-for-you semantic layer and reliable reporting so marketing, sales, and finance can work from the same number instead of three competing screenshots. If you want a pressure test on your current CPL logic, book a call and get a free first dashboard built around definitions your leadership team can trust.