Roughly one-third of customers contribute negatively to profit after cost-to-serve once you allocate the work required to serve them. If your revenue is climbing while margin keeps getting worse, you probably don't have a sales problem. You have a visibility problem.
You're likely staring at a familiar mess right now. The P&L says the company is growing. The sales team is proud. The board wants more of the same. Meanwhile, cash feels tighter than it should, ops is constantly firefighting, support is buried, and finance keeps finding “one-off” costs that somehow happen every week.
That's usually when founders discover the ugly truth. The customer everyone calls “strategic” may be the one burning the most profit. Big orders with awkward shipping windows. Endless exceptions. Custom invoicing. Returns. Slack pings. Manual fixes. Extra account management. None of that shows up cleanly in a standard gross margin view.
Cost-to-serve analysis exists to stop that nonsense. It started as a finance discipline tied to activity-based costing, then became far more useful once companies could trace sales, service, logistics, and admin costs at the customer and order level instead of smearing them across the whole customer base through averages. That shift turned it from an accounting concept into a real operating tool for decision-making (historical overview of ABC and customer-service costing).
Most content stops there. It tells you what cost-to-serve is, then dumps you back into supply-chain accounting language. That's not the problem. The problem is knowing which customers, channels, and service promises are destroying profit, then having reporting you can trust enough to act on it.
Table of Contents
- The Hidden Cost of Growing Revenue
- How Cost-to-Serve Actually Works
- Turning Data Into Strategic Decisions
- Why DIY Reporting Often Fails
- The Agentic BI Alternative
- Protecting Your Profit Margins
The Hidden Cost of Growing Revenue
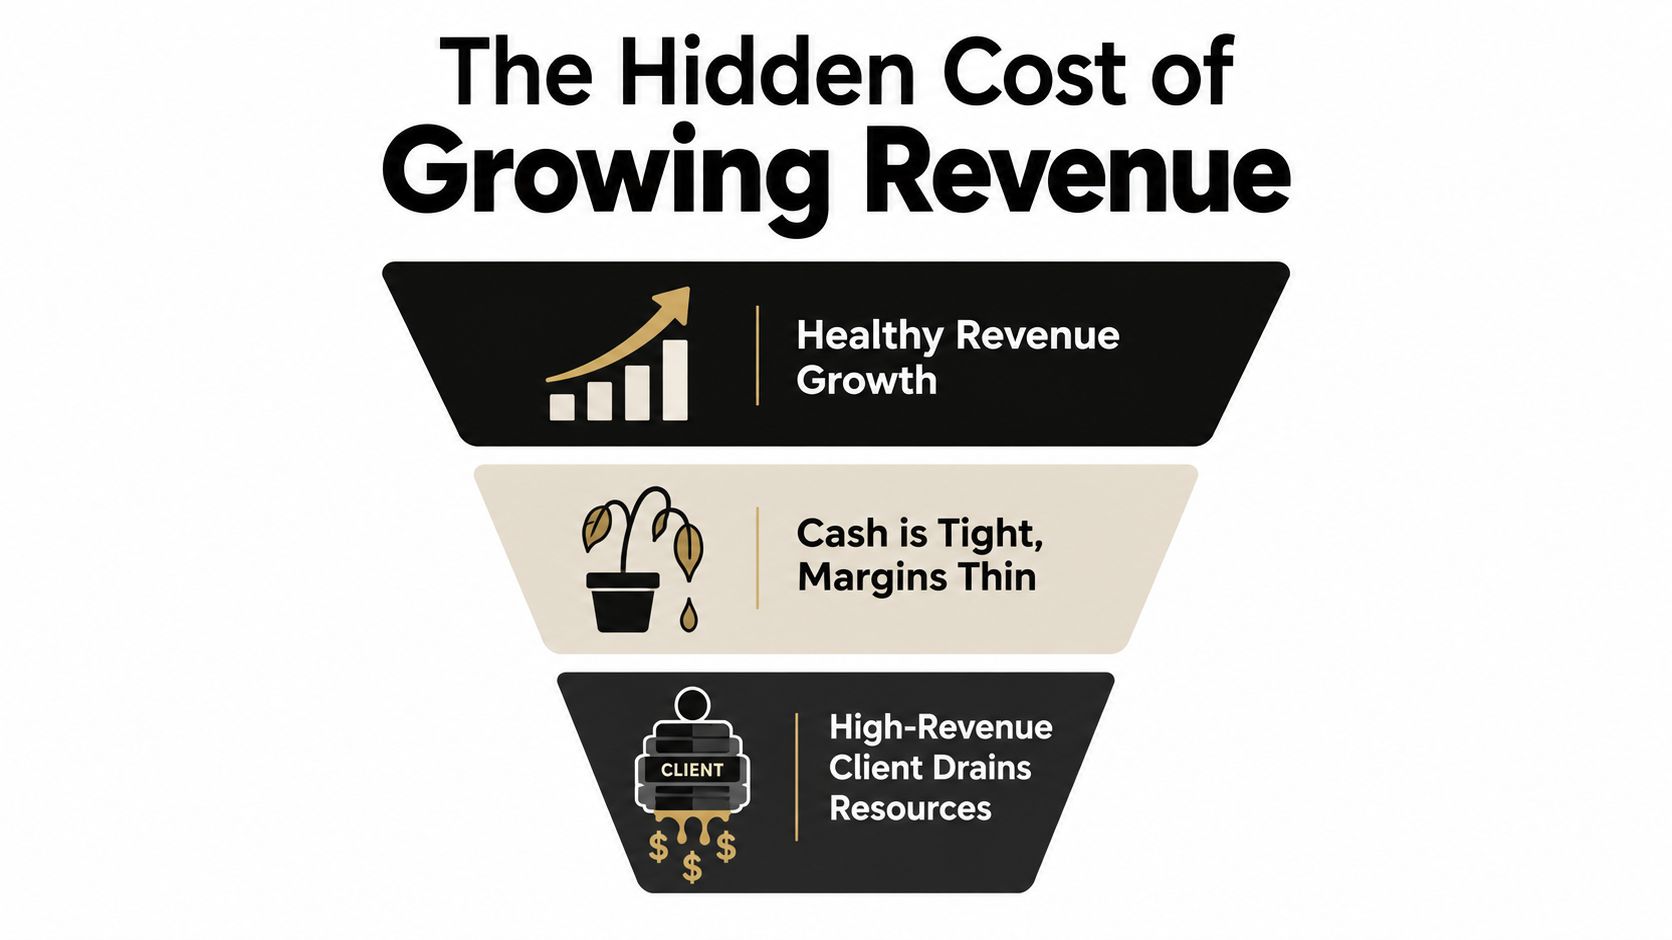
Revenue goes up. Everyone celebrates. Then operations pays for it.
The pattern is predictable. Sales lands a few bigger accounts, orders increase, and the business starts missing the signals that matter. Fulfillment gets messy. Support queues stay full. Finance sees margin erosion but cannot pin it to a customer, channel, or service promise. Growth looks healthy on the dashboard and expensive everywhere else.
That happens because many leadership teams still evaluate customers at the wrong level. They look at revenue, blended margin, and account size. They do not trace the cost of serving each account. The customer who orders on standard terms and causes no trouble gets mixed in with the one that needs split shipments, special handling, manual invoicing, expedited support, and constant exceptions.
What operators usually miss
The margin leak rarely sits in one obvious line item. It shows up as friction spread across the business.
- Order complexity: Small, frequent, irregular orders consume more labor than clean, predictable ones.
- Service burden: Some accounts generate more calls, escalations, follow-up, and internal coordination.
- Commercial exceptions: Custom terms, invoice disputes, returns, and special approvals create admin cost that standard margin reports bury.
- Logistics sprawl: Rush shipments, split deliveries, and awkward routing drive up handling and transportation cost.
That is why cost-to-serve matters. It shows which customers are profitable because they fit your operating model, and which customers look good only because finance is averaging away the damage.
The loudest revenue number often hides the weakest economics.
A lot of companies know this at gut level and still fail to act because gut feel does not survive a planning meeting. You need cost attribution that ties work to the customers creating it. As noted earlier, better system data made that possible. ERP, WMS, TMS, and CRM records now make customer-level profitability measurable instead of speculative.
The strategic gap is not understanding the concept. The gap is using it to identify profit-destroying segments and fix them. That means changing pricing, service levels, order minimums, channel terms, account coverage, and in some cases firing bad revenue. Plenty of teams stop at reporting. Operators do not get paid for reports. They get paid for margin.
A widely cited cost-to-serve benchmark argues that a meaningful share of customers become unprofitable once companies allocate the actual cost of fulfilling and supporting them, especially in the long tail of small, frequent, complex orders (cost-to-serve index and profitability patterns). That should not surprise anyone who has run operations.
If you plan to build this capability internally, price that decision realistically. The reporting itself is not the only cost. Hiring the wrong analyst, buying partial tooling, and waiting six months for answers is expensive. This breakdown of data team and reporting cost tradeoffs lays out where that money goes.
How Cost-to-Serve Actually Works
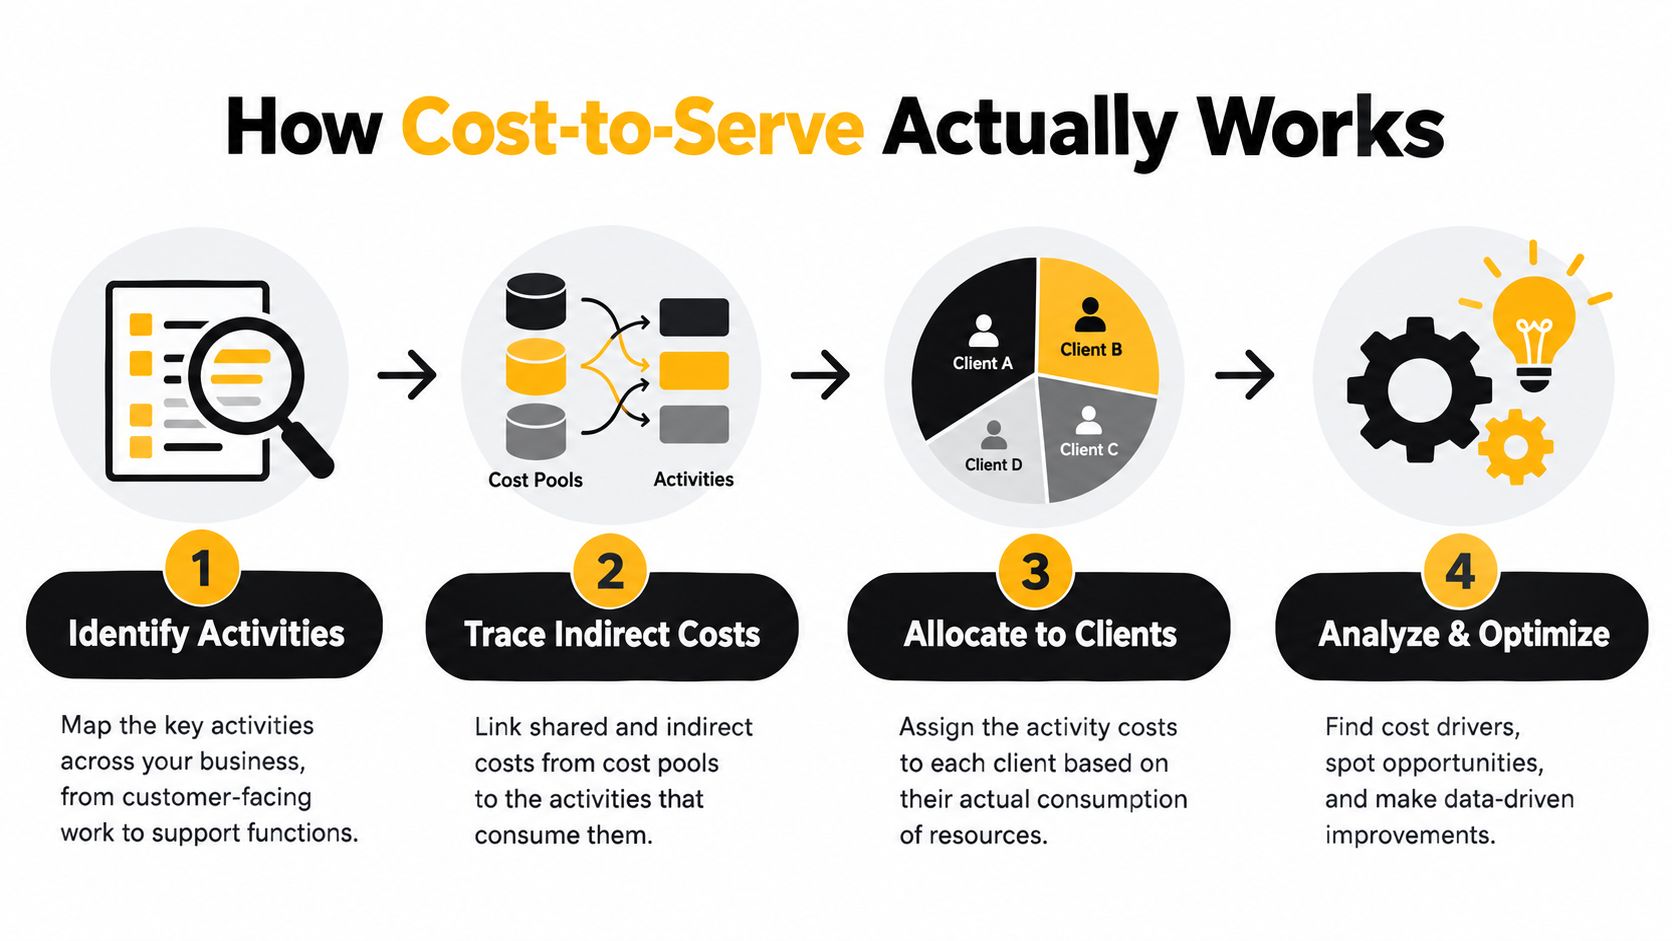
Cost-to-serve analysis works when you stop averaging and start tracing work to the activities that create it. That's why activity-based costing sits underneath any serious model.
A restaurant. Looking only at ingredient cost tells you almost nothing about profitability by dish. One item may use the same raw ingredients as another but require more prep, more labor, more plating time, and more remake risk. Customers don't buy your chart of accounts. They buy an operational experience, and that experience costs money to deliver.
The engine is activity-based costing
Cost-to-serve analysis is most accurate when indirect and support costs are allocated using activity-based costing rather than blunt averages. The logic is straightforward. Overhead is driven by customer activities such as order lines, calls handled, picks packed, changeovers, and miles driven. In that model, cost is calculated by tracing resource consumption through activity cost pools and drivers, which exposes complexity and service intensity that standard gross-margin reporting hides (activity-based costing and cost driver allocation).
Here's the practical difference:
| Reporting approach | What it tells you | What it hides |
|---|---|---|
| Standard gross margin | Revenue minus direct product cost | Support burden, handling complexity, exception work |
| Department averages | Total overhead spread across accounts | Which customers actually trigger the overhead |
| Cost-to-serve analysis | Customer or segment profitability after service reality | Much less, if the model is built on real activities |
A lot of SME operators also find pricing discussions get sharper once they understand activity based pricing for SMEs. It's useful because pricing and service design belong in the same conversation, not in separate silos.
What good CTS logic looks like
You don't need a giant theory deck. You need a model that answers a few blunt questions:
- Which customers create the most operational drag?
- Which channels generate too much exception handling?
- Which service promises are expensive enough to justify different pricing or terms?
- Where are support and admin costs leaking margin after the sale?
This short explainer helps if you want a plain-language view of the mechanics:
The hard part isn't concept. It's cost logic. If your team is still arguing about what belongs in overhead and what belongs in customer servicing, this guide to cost allocation methods is the right place to clean up the thinking.
Practical rule: If a customer causes more work, that customer should carry more cost. Anything else is finance cosplay.
Turning Data Into Strategic Decisions
Most companies stop at the report. That's where they waste the value.
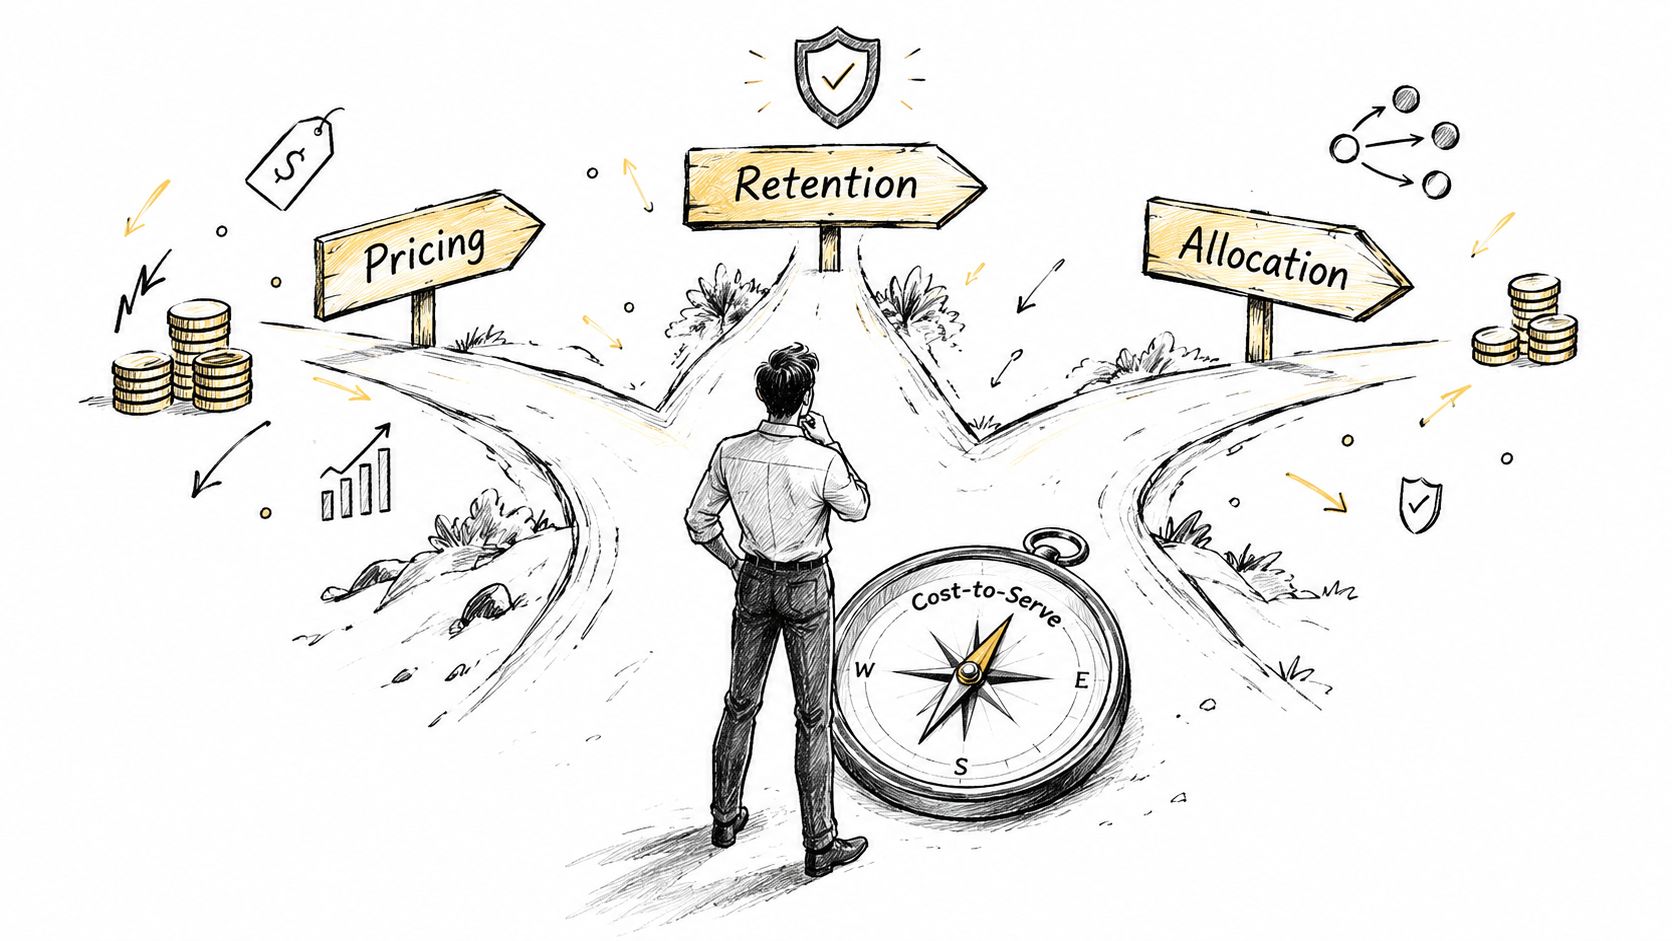
A cost-to-serve analysis isn't there to impress finance. It's there to help leadership make better decisions about pricing, retention, segmentation, and service design. If your analysis ends with “interesting insight,” you've done half the job and skipped the expensive half.
The right question isn't who bought most
The right question is who creates durable profit after all work is counted.
That changes how an operator looks at the book of business. A customer can be worth keeping even if they're currently unprofitable, but only if there's a realistic path to fixing the economics. If there isn't, you're subsidizing complexity with founder optimism.
Here are the decisions cost-to-serve should drive:
- Pricing resets: High-friction customers often need different pricing, minimums, or service terms.
- Segment cleanup: Some segments look attractive in acquisition reports and terrible in operating reality.
- Channel discipline: A channel with strong demand but ugly operational complexity can wreck the model.
- Service redesign: White-glove treatment should be intentional and paid for, not given away by default.
What to do with unprofitable segments
Don't jump straight to firing customers. That's lazy management.
Use cost-to-serve analysis to sort accounts into buckets:
| Customer situation | Smart move |
|---|---|
| Good revenue, good economics | Protect and expand |
| Good revenue, bad economics, fixable behavior | Renegotiate terms or redesign service |
| Good revenue, bad economics, not fixable | Raise price or walk away |
| Low revenue, high complexity | Stop pretending they're strategic |
Independent coverage in 2025 pushed a point more operators need to hear. Cost-to-serve should reveal true transaction-level profitability, and companies should start with a pilot scope rather than broad rollouts (Gartner newsroom coverage on CTS implementation). That matters because leadership teams usually get stuck trying to model everything at once. They build complexity before they build usefulness.
Start narrow. Pick one region, one channel, or one customer segment. If the model can't change a decision there, it won't help the wider business either.
A good operator uses cost-to-serve to force tradeoff conversations that teams normally avoid. Sales wants flexibility. Ops wants standardization. Finance wants margin. Customer success wants retention. CTS gives them one shared lens: what does this customer relationship cost to maintain?
Why DIY Reporting Often Fails
The usual response to this problem is predictable. Someone says, “We should hire an analyst,” and someone else says, “Let's pull it together in spreadsheets first.”
Both can go wrong fast.
Spreadsheets feel cheap until they become the company's shadow data warehouse. Then every meeting turns into a dispute over whose export is right. Salesforce says one thing. The ERP says another. Finance has a third version in a monthly workbook nobody wants to touch. RevOps adds a dashboard layer on top and hopes nobody notices that the metric definitions don't match.
The spreadsheet trap
DIY reporting breaks because cost-to-serve sits across functions. It needs commercial data, fulfillment data, service data, and finance logic to agree with each other. That's hard enough with a real data model. It's miserable when the business is stitching CSVs together under deadline pressure.
Common failure modes look like this:
- Different metric definitions: Booked revenue, billed revenue, shipped revenue, and recognized revenue get mixed together.
- Half-loaded costs: Teams include freight and forget support, admin, returns, or exception handling.
- One person dependency: The “data owner” becomes the only person who knows how the workbook works.
- No trust at exec level: Once leaders find a few inconsistencies, they stop using the output.
The hiring trap
The other mistake is assuming a full-time hire solves the problem by default.
A first data hire without clean business definitions usually spends months untangling source systems, politics, and metric arguments. That person can be smart and still fail, because the company hired for a role when it needed a reporting foundation. Founders often think they're buying dashboards. They're really buying data modeling, stakeholder management, business translation, and ongoing metric governance.
If your systems disagree and your teams define revenue differently, one analyst won't rescue you. You'll just have a smarter person producing disputed charts.
That's why plenty of internal builds stall. The issue isn't effort. The issue is that the company doesn't need a generic hire. It needs a trustworthy layer between raw systems and executive decisions.
The Agentic BI Alternative
There's a better way to handle this than cobbling together dashboards or rolling the dice on a first full-time data hire. Build a reliable semantic layer once, then let people ask plain-English questions against numbers the business agrees on.
That's the practical promise behind agentic BI. Not “AI magic.” Not a chatbot duct-taped to broken metrics. A governed reporting foundation that makes customer, channel, and profitability questions answerable without reopening the same argument every week.

What changes when the metric layer is trustworthy
When the underlying data model is reliable, leaders can ask better questions faster:
- Customer profitability questions: Which accounts are profitable after support and exception handling?
- Channel questions: Which acquisition sources bring in customers that are operationally expensive to retain?
- Service-level questions: Which promises create margin leakage that pricing doesn't cover?
- Trend questions: Where is complexity rising before the P&L makes it obvious?
Most BI projects fail. They focus on dashboard output instead of metric trust. The chart design isn't the bottleneck. The meaning of the number is.
Why this model fits companies without a data team
For companies in the 20 to 200 employee range, the smartest setup is usually not a heavyweight internal analytics function on day one. It's a done-for-you reporting layer that creates shared definitions, reliable models, and AI-queryable access without adding management overhead.
That approach is especially useful for cost-to-serve analysis because CTS cuts across sales, operations, support, and finance. If those teams don't agree on the inputs, the analysis becomes theater. If they do agree, leadership can finally use the output to make decisions instead of debating whether the dashboard is wrong.
If you want a grounded explanation of what this category is trying to solve, read this overview of agentic analytics. The important point is simple: plain-English answers only matter when the underlying business logic is solid.
A fast wrong answer is worse than a slow right one. Agentic BI only works when the semantics are controlled.
Protecting Your Profit Margins
Cost-to-serve analysis matters because it forces honesty.
It tells you which revenue is healthy and which revenue is expensive theater. It shows where complexity is creeping into the model. It gives leaders permission to fix pricing, narrow service levels, renegotiate bad-fit accounts, and stop subsidizing chaos.
What strong operators do next
If you want this work to protect margin instead of becoming another dead reporting project, keep the standard high.
- Focus on decisions, not dashboards: The analysis should change pricing, retention, segmentation, or service design.
- Use a pilot scope first: Narrow scope exposes whether the logic is useful before the business overbuilds.
- Insist on shared definitions: Finance, RevOps, ops, and support have to agree on what counts as serving cost.
- Treat trust as the product: If executives don't trust the number, the rest doesn't matter.
The companies that get value from cost-to-serve analysis don't treat it like an accounting side quest. They use it as a management system. They stop asking who bought the most and start asking who's worth serving under current terms.
The blunt conclusion
If margin is slipping while revenue rises, stop celebrating volume and start tracing cost.
If your reporting is fragmented, stop pretending another spreadsheet will fix it.
If you're considering a full-time data hire, be honest about what you really need. You probably don't need a lone analyst building fragile reports from conflicting systems. You need a reliable decision layer that tells you where profit is leaking and gives your team numbers it can act on with confidence.
HelpWithMetrics gives companies without a data team a done-for-you agentic BI setup that makes metrics trustworthy and AI-queryable, including the kind of customer and channel profitability views that cost-to-serve analysis depends on. If you're tired of arguing over exports and want a clear picture of which revenue protects margin, visit HelpWithMetrics to book a call and get a free first dashboard.