Most advice about a culture of data starts in the wrong place. Leaders are told to buy a better dashboard, train employees to read charts, or hire an analyst who can “make the numbers accessible.” Those actions can help, but they don't solve the central problem when Finance, RevOps, Product, and Sales use different definitions for the same business metric.
A culture of data is a trust and ownership system. People use data consistently when they know who owns a metric, what it means, where it comes from, and whether the number will hold up in the next meeting. The software matters, but it comes after the operating agreement.
The historical benchmarks are blunt. BARC's data culture survey found that the share of businesses with at least 50% data-driven decision-making rose from 41% to 80% over seven years, while partially or purely data-driven decision-making increased from 14% to 34%. Yet an AWS benchmark on data-driven organizations reported that 99% of blue-chip companies had invested in data initiatives, while only 24% had successfully created a data-driven organization. Culture, not infrastructure, was identified as the biggest impediment by 92% of companies in that benchmark.
That gap explains why companies can spend heavily on analytics and still argue over the board report.
Table of Contents
- Why Your Dashboard Problem Is Not a Tool Problem
- Defining a Culture of Data for Non-Technical Leaders
- The Anatomy of Healthy Versus Broken Data Cultures
- The Hidden Costs of Delay and Bad Hiring
- How a Semantic Layer Fixes Metric Drift
- Building Trust Through Governance and Reporting
Why Your Dashboard Problem Is Not a Tool Problem
Buying another dashboard won't create trust. It may create another interpretation of the truth.
A typical growing company has data in a CRM, billing platform, product database, spreadsheets, and a finance system. Each tool can produce a report that looks credible. The problem appears when one report calculates “active customer” based on a login, another uses a paid subscription, and a third excludes accounts with overdue invoices. All three dashboards may be technically correct according to their local logic. Together, they create operational confusion.
The AWS benchmark makes the trade-off clear. Investment in data initiatives is widespread, but successful data-driven operations remain uncommon, and 92% of surveyed companies named culture as their biggest impediment. More storage, more dashboards, and more models won't resolve a disagreement about ownership or definitions. They allow each department to publish its version faster.
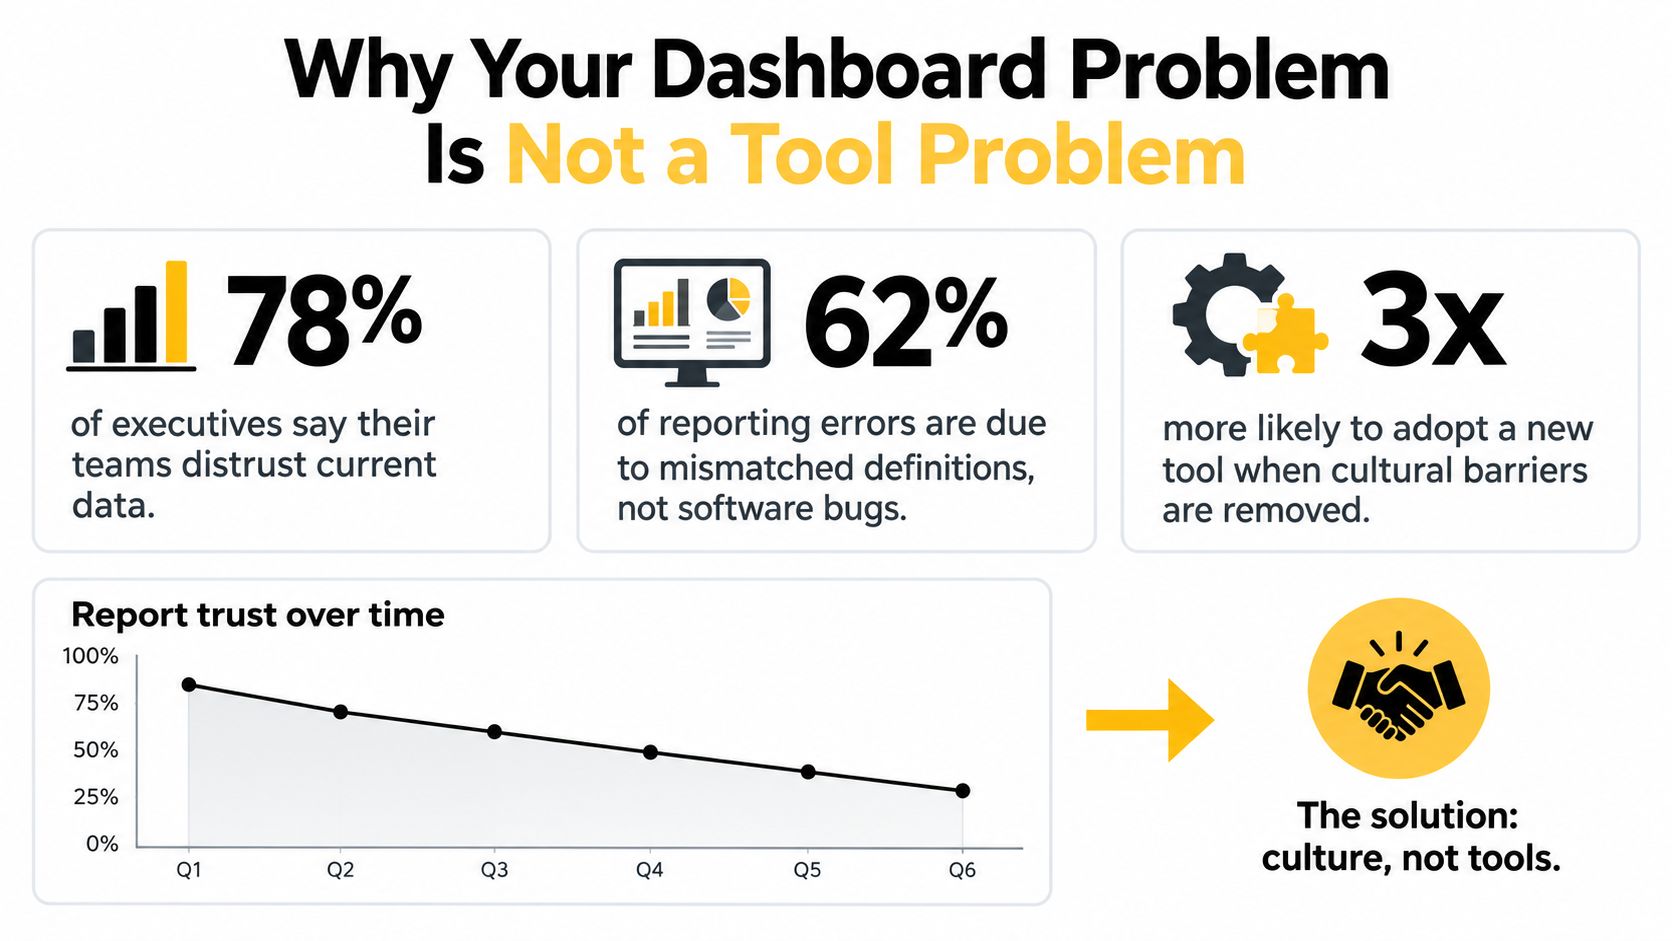
Visibility is not the same as confidence
A dashboard answers a question only when the organization agrees on the question first. “What is revenue?” sounds straightforward until teams debate whether it means invoiced revenue, recognized revenue, collected cash, recurring revenue, or a forecast.
The semantic layer guidance from Atlan describes the practical answer: a semantic layer turns raw warehouse schema into governed business terms and metric definitions. That lets dashboards, AI agents, and other tools resolve the same KPI consistently instead of re-implementing revenue, churn, or active-customer logic independently.
This is why a dashboard problem often presents as a software problem but behaves like a governance problem. Leaders see conflicting charts. Teams see conflicting incentives. The organization needs a shared definition and an accountable owner before it needs another visualization.
Practical rule: If two trusted leaders can produce different answers from the same question, stop buying reporting tools and resolve the metric definition.
For readers evaluating the broader analytics function, this trusted data metrics resource offers useful context on the roles and capabilities companies often try to build internally. It shouldn't distract from the immediate decision, though. A company can hire strong technical talent and still fail if no executive decides which number governs the business.
Tool selection still matters. A startup comparing platforms can use this guide to BI tools for startups as a starting point, but the conclusion should be operational rather than cosmetic. Choose the stack that supports governed definitions, clear access, and accountable reporting. Don't confuse a polished interface with a culture that trusts its metrics.
Defining a Culture of Data for Non-Technical Leaders
A culture of data exists when people use shared, reliable information as part of ordinary decision-making. It isn't a personality trait, a data department, or a CEO preference for spreadsheets. It is the organization's operating system for turning questions into decisions.
A healthy culture shortens the distance between “I have a question” and “I have an answer I can defend.” That requires more than access. It requires agreement about meaning, responsibility for quality, and a routine expectation that important decisions include evidence.

Four conditions make the culture real
Shared metric definitions come first. Everyone doesn't need to understand SQL, but everyone involved in a decision needs to understand what “net revenue retention,” “pipeline,” or “churn” includes and excludes. A metric name without a definition is a label, not a control.
Clear ownership prevents the familiar failure mode where everyone uses a number but nobody is responsible for it. Finance may own recognized revenue, Product may own feature adoption, and RevOps may own pipeline stages. The exact arrangement varies, but the accountability can't remain ambiguous.
Appropriate access means people can answer legitimate business questions without waiting for one overloaded specialist. Access doesn't mean unrestricted exposure to sensitive information. Governance should determine who can see which data, in which context, with enough documentation to interpret it correctly.
Data-backed decisions create the behavioral reinforcement. Leaders need to ask which evidence supports a forecast, pricing decision, hiring plan, or product priority. They also need to tolerate an answer that challenges the preferred narrative. If executives request data only after making the decision, employees learn that data is presentation material, not operating input.
The BARC survey found that 81% of respondents viewed data or information as an asset, and 76% said their company was striving for a data culture. Those figures show broad recognition of the goal. They don't prove that employees trust the reporting or know how to use it. The difference between aspiration and practice is where ownership, governance, and usable reporting matter.
Leadership sets the default behavior
A founder who asks for evidence, accepts uncertainty, and follows the agreed metric definition sends a stronger signal than a training session. A leader who overrides the agreed number because it produces a more convenient narrative teaches the organization to keep private spreadsheets.
The culture also needs to accommodate different levels of data fluency. A RevOps lead may need detailed funnel analysis, while a sales manager may need a reliable view of coverage and conversion. Training can help, but access to the right answer in plain language often matters more than teaching every employee to become an analyst.
Companies building distributed teams can also review data job listings for remote workers to understand how organizations define analytics responsibilities. The hiring market can inform role design, but it can't replace internal decisions about what the role owns.
The Anatomy of Healthy Versus Broken Data Cultures
You can diagnose a culture of data by watching what happens before an important meeting. In a healthy organization, leaders discuss the implication of a number. In a broken one, they spend the meeting deciding whether the number is valid.
The visible symptoms are familiar: spreadsheet sprawl, duplicated reports, manual reconciliations, and one person who “knows where the numbers are.” Those symptoms aren't merely inefficient. They reveal that metric ownership sits in people's memory instead of in a shared operating system.
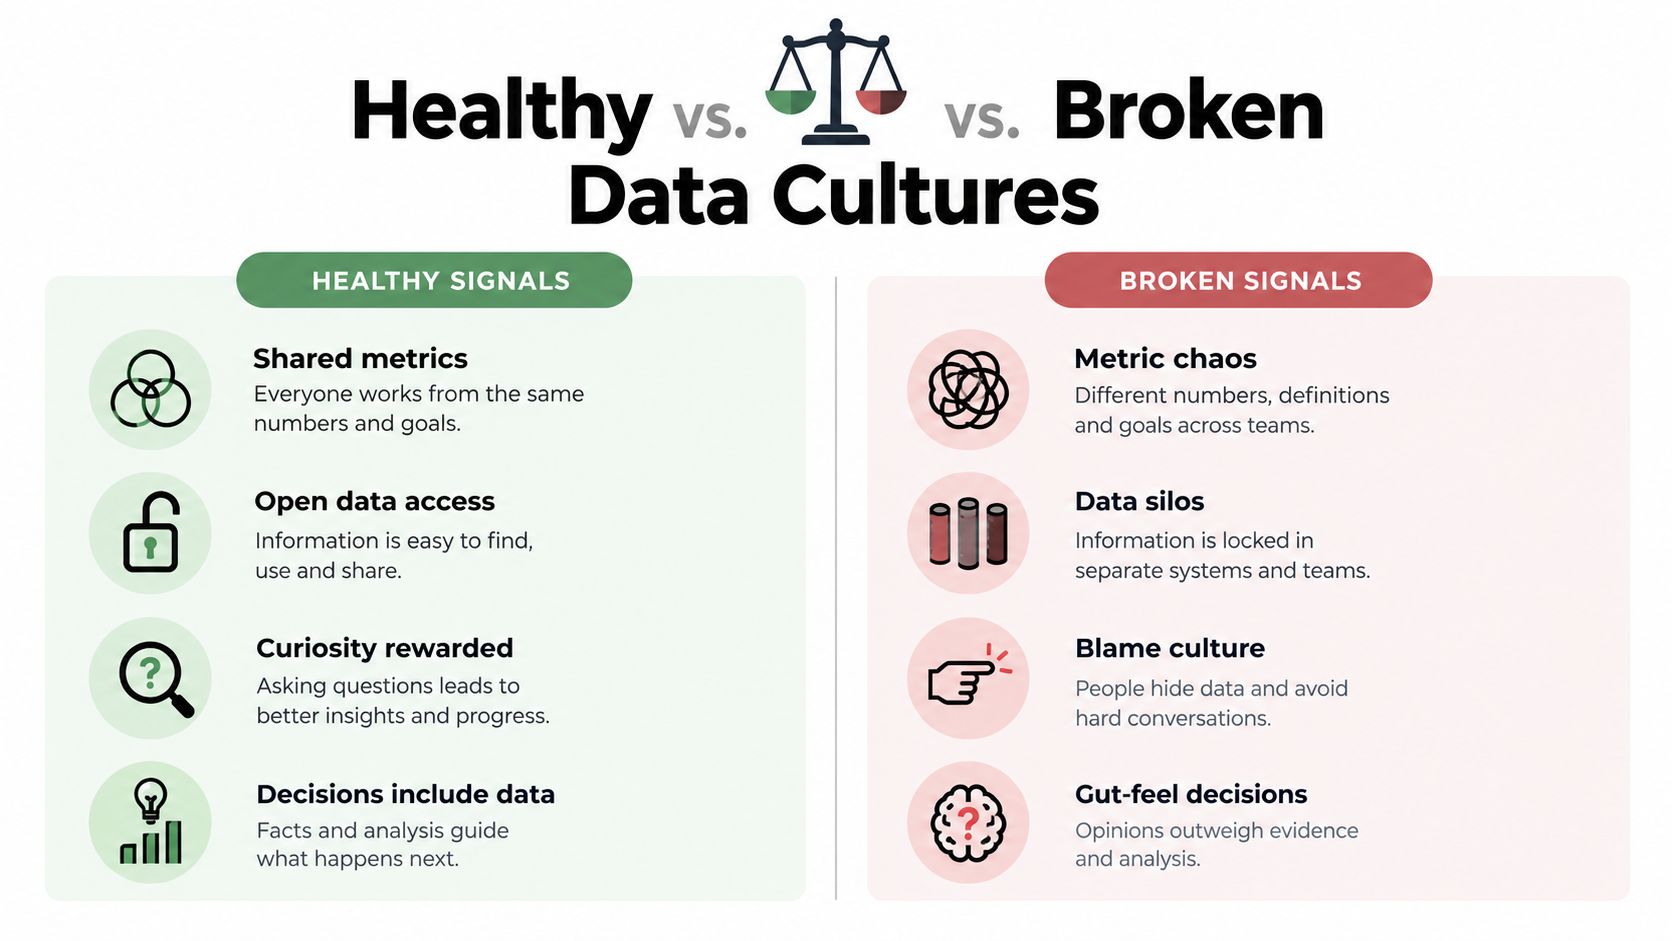
The signals leaders should look for
| Healthy culture | Broken culture |
|---|---|
| Shared metrics: Teams use agreed definitions and know who owns them. | Metric chaos: The same term changes meaning across reports. |
| Open, governed access: People can find relevant information without bypassing controls. | Data silos: Each department protects its own version of performance. |
| Curiosity is rewarded: Questions lead to investigation rather than defensiveness. | Blame culture: Teams hide uncertainty because bad numbers become personal criticism. |
| Decisions include data: Evidence informs the decision alongside judgment and context. | Gut-feel decisions: Leaders use data after the decision to justify it. |
These differences produce practical outcomes. A healthy culture lets teams move from a shared fact to a business discussion. A broken culture forces every discussion back into reconciliation. The company loses speed, but the more serious cost is strategic distortion. Leaders may cancel a channel, change a pricing plan, or alter hiring priorities because two systems disagree.
Why a single analyst won't fix ownership
A capable analyst can consolidate reports, identify anomalies, and explain trends. That person can't unilaterally decide whether Finance or Product owns a metric, nor can they force executives to use the agreed definition. If the organization gives one analyst responsibility without authority, the hire becomes a human translation layer between incompatible systems.
The same applies to buying a new BI platform. The platform may improve querying, visualization, and distribution. It won't decide which source takes precedence when billing and CRM disagree. It won't create a policy for late-arriving data. It won't stop a department from downloading a spreadsheet and circulating an unofficial number.
A mature culture doesn't eliminate judgment. It makes the facts underneath that judgment stable enough to debate.
Leaders should therefore inspect behaviors, not slogans. Ask whether the last executive report had an owner, whether metric changes were documented, and whether teams can explain why a number changed. If the answer depends on one employee's memory, the organization has a resilience problem as well as a reporting problem.
The Hidden Costs of Delay and Bad Hiring
The first data-hire decision is often framed as a salary question. That framing is too narrow for a company with 20 to 200 employees and no data team. The choice is between building an internal capability immediately, buying a managed capability, or accepting continued uncertainty while the organization decides.
Independent 2025 to 2026 cost estimates cited in the brief place the fully loaded annual cost of in-house analytics talent above $225,000 to $282,500 once salary, recruiting, and onboarding are included, as reported by SR Analytics on analytics outsourcing costs. Other 2026 guidance places a dedicated remote analyst through a managed provider at approximately $1,408 to $1,936 per month, while loaded full-time equivalents are estimated at $102,000 to $156,000 before recruiting, tooling, and vacancy time. These are estimates, not universal price tags, and the comparison depends on role scope and service quality.
The decision becomes clearer when you separate capacity from capability.
What the internal hire actually requires
A full-time analyst may be the right choice when the company has sustained analytical demand, an executive willing to own prioritization, and enough process maturity to support the role. The hire still needs source access, business context, metric definitions, stakeholder time, and a decision process for competing requests.
Without those conditions, the analyst may spend their early months collecting spreadsheets, reverse-engineering undocumented logic, and mediating disagreements between department heads. The company pays for analytical talent while asking that person to perform data governance, systems integration, reporting operations, and stakeholder management at once.
A bad hire creates a second-order problem. Founders often don't discover the mismatch immediately because the output looks busy. Dashboards appear, but the underlying definitions remain unsettled. When confidence doesn't improve, leaders conclude that analytics doesn't work, even though the organization never gave the role a workable mandate.
The cost of waiting is harder to see
Conflicting metrics delay decisions. A forecast gets revisited, a board pack changes, a growth experiment lacks a consistent baseline, or a customer segment receives attention based on an inconsistent definition. The financial effect varies by company, so it shouldn't be reduced to a fabricated universal estimate. The operational pattern is consistent, though: unresolved reporting disputes consume leadership time and make action less timely.
A managed or fractional model can be safer when the immediate need is reliable delivery rather than building a permanent department. It can provide a defined reporting function while the company learns which questions recur, which metrics deserve formal ownership, and whether future demand justifies a full-time role.
A decision test for founders
| Choose an internal hire when | Consider managed capacity when |
|---|---|
| Demand is sustained: The role will support recurring analytical work across the business. | The need is immediate: Leadership needs trusted reporting before it can design a mature data function. |
| Ownership exists: An executive can prioritize requests and resolve metric disputes. | Definitions are unsettled: An external operating model can help establish governed metrics. |
| The company can support the role: Systems, access, and stakeholder time are available. | Hiring risk is material: The cost of a mismatch would exceed the value of early internal ownership. |
The right question isn't “Can we afford an analyst?” It is “What capability must exist first, and who can deliver it with accountable ownership?” For many smaller organizations, a governed reporting function comes before a permanent analyst, not after one.
How a Semantic Layer Fixes Metric Drift
A semantic layer is the missing bridge between raw data and business reporting. It translates warehouse structures into shared terms such as revenue, churn, customer, order, and active account. Dashboards and AI agents then use those governed definitions instead of rebuilding the logic separately.
That distinction matters because metric drift begins when tools interpret the same business term independently. One dashboard may calculate churn from canceled subscriptions, another from lost recurring revenue, and an AI assistant may infer a third definition from column names. The semantic layer gives each system a common contract.
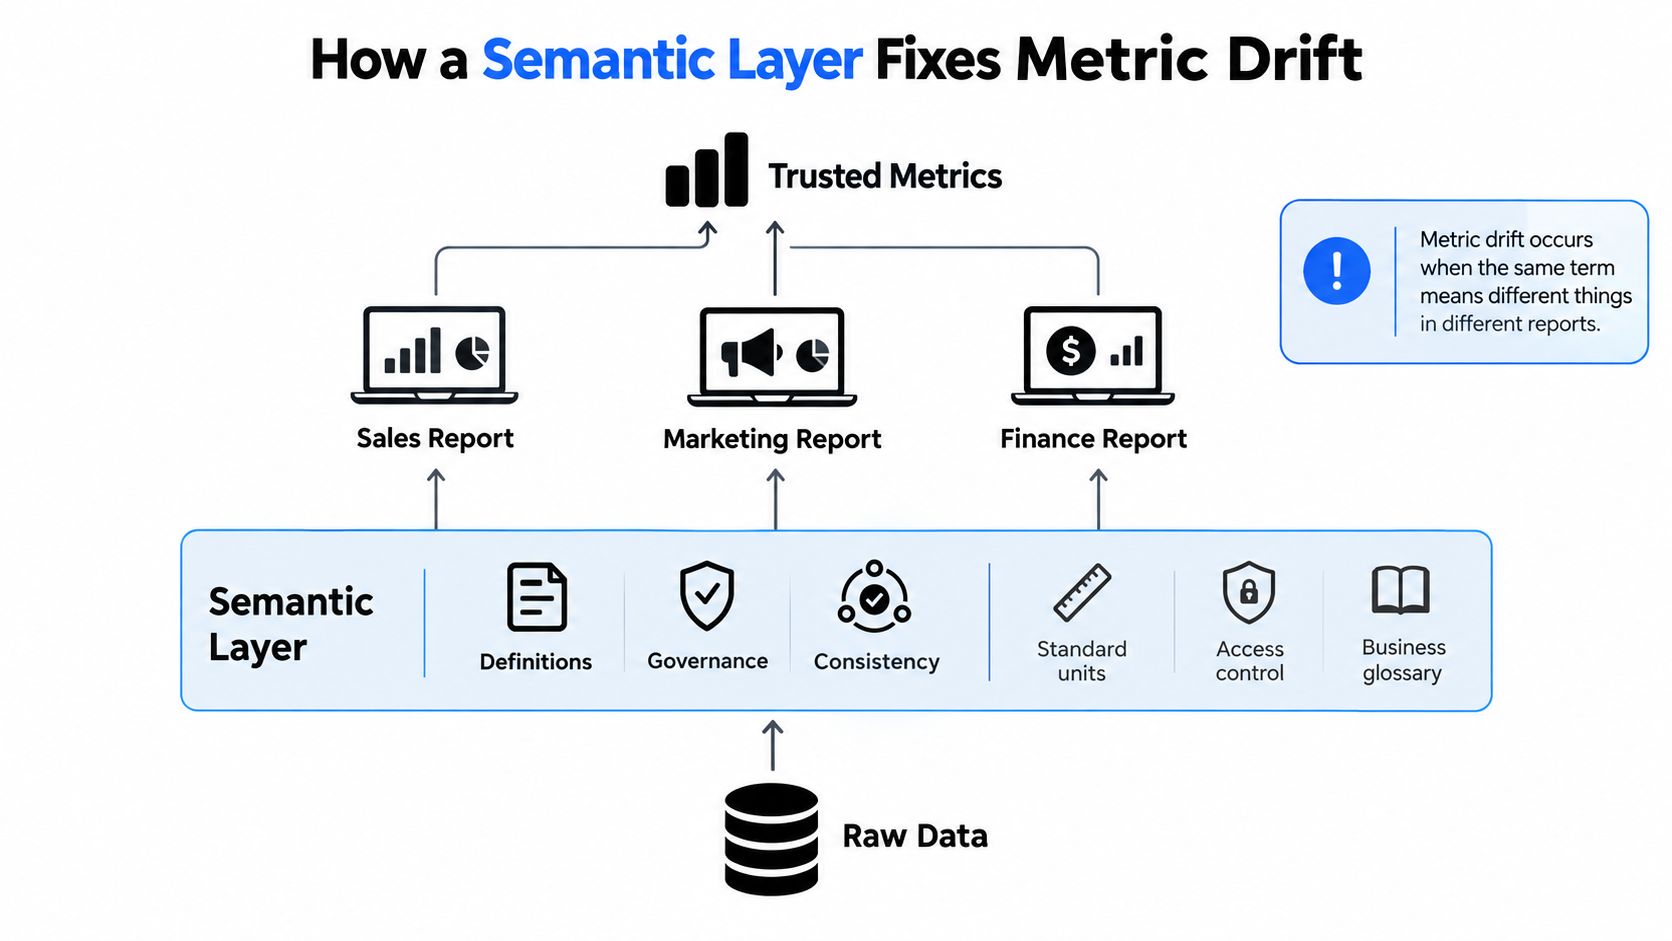
Architecture versus staffing
An internal analyst builds organizational knowledge over time, but the company carries the full cost of recruiting, onboarding, vacancy, management, and retention. A managed agentic BI service offers a different trade-off. It prioritizes a defined outcome, reliable metrics delivery, and plain-English access to reporting without requiring the company to assemble every capability internally.
The comparison shouldn't be reduced to “employee versus software.” A person can resolve ambiguity, but a person shouldn't be the only place where metric logic lives. A service can accelerate delivery, but it still needs executive decisions about ownership, precedence, and acceptable definitions. In both models, governance remains essential.
For a founder, the useful distinction is between building a team and establishing a trusted operating layer. If the immediate problem is that the board report changes depending on which spreadsheet someone opened, the operating layer has priority. If the company later needs extensive experimentation, advanced modeling, and embedded analysts across functions, internal hiring may become justified.
The semantic layer architecture guide provides additional context on how this layer fits between connected data sources and reporting experiences. The important business outcome is simpler than the architecture diagram: Sales, Marketing, Finance, and Product should be able to ask related questions and receive answers based on the same definitions.
Agentic BI needs governance to be useful
Agentic BI lets non-technical users ask questions in plain English and receive charts or answers. Without governed semantics, that convenience can make inconsistency worse. A fast answer based on the wrong definition is more dangerous than a slow answer that prompts the team to resolve ambiguity.
With a semantic layer, the agent can operate against documented business logic, source precedence, and access rules. That makes the output more suitable for recurring management reporting and board discussions. It doesn't remove the need for judgment. It reduces the risk that every question starts with a hidden disagreement about what the words mean.
HelpWithMetrics is one managed option in this category. It provides semantic-layer setup, connected-source metric delivery, and auditable answers inside a client's stack, with a done-for-you model priced at $5,000 per month flat according to the publisher information provided for this article. The relevant comparison is not whether the service replaces every future data hire. It is whether it can establish trustworthy delivery before the company commits to a permanent analytics function.
Building Trust Through Governance and Reporting
A culture of data becomes visible in the board meeting. In a weak operating model, the CFO presents one revenue figure, the RevOps leader has another, and Product brings a retention view that can't be reconciled quickly. The conversation turns into a defense of spreadsheets. In a stronger model, the group debates what the trend means, what decision follows, and where uncertainty remains.
Trust doesn't mean every number is perfect. It means the organization knows the definition, source, owner, refresh context, and change history well enough to use the number responsibly. Governance frameworks emphasize structures, policies, rules, and controls that align responsibilities and interests. The data analytics governance research connects those principles with practical mechanisms such as ownership, stewardship, metadata management, access control, and compliance.
Reporting should create accountability
A reliable reporting model answers five executive questions:
- What does this metric mean? The definition should be explicit and understandable.
- Who owns it? One accountable function should resolve disputes and approve changes.
- Which source takes precedence? Conflicting systems need an agreed hierarchy.
- Can users trace the answer? Reports should expose enough context to support review.
- What changed? Metric or source changes should be visible rather than introduced.
This applies beyond SaaS. Leaders who need to govern data in manufacturing will face the same ownership and consistency challenge across operational systems, even though the underlying processes differ. Governance is not a documentation exercise. It determines whether teams can rely on shared information when production, finance, sales, and planning decisions collide.
A practical operating model should make trusted reporting routine. The data governance operating model guide offers a framework for connecting metric ownership, decision rights, and reporting processes. The goal isn't to produce a large policy library. It is to make the right number easy to find, explain, and defend.
The sequence is straightforward. Establish the metrics that matter, assign ownership, reconcile source precedence, expose definitions through a semantic layer, and deliver reports that leaders can question without reopening the entire data pipeline. Tools and hiring support that sequence. They don't substitute for it.
The strongest culture of data isn't the one with the most dashboards. It's the one where people trust the numbers enough to stop arguing about which number is right and start making the decision.
HelpWithMetrics provides a done-for-you agentic BI function for companies with 20 to 200 employees, connecting sources, governing metric definitions, and delivering plain-English answers through a semantic layer. Visit HelpWithMetrics to book a call and get a free first dashboard built around the metrics your leadership team uses.