A standard US hire usually costs 1.25x to 1.4x base salary, and the fully loaded cost can climb to 1.5x to 2.5x once overhead, recruiting, and ramp time are included. A $100,000 analyst isn't a $100,000 decision. It's a materially larger first-year commitment before the person produces dependable output.
That distinction matters most for a SaaS company making its first data hire. The salary is easy to approve because it appears as one clean line in the hiring plan. The actual expense is scattered across payroll taxes, benefits, equipment, software, recruiting, management time, onboarding, and the decisions delayed while the new hire learns the business.
Founders usually compare a full-time analyst with a contractor or a monthly BI invoice. That's the wrong comparison if the employee's number is salary only. The useful comparison is first-year fully loaded cost versus the cost and speed of buying a complete reporting outcome.
Table of Contents
- What Most Founders Get Wrong About Hiring Cost
- What Fully Loaded Cost Actually Includes
- The Real Math on a US Data Analyst Hire
- How Loaded Cost Varies by Role and by Year One
- The Hidden Cost of Slow Decisions and Fragmented Reporting
- Hiring a Data Analyst vs a Done-For-You BI Service
- When Hiring Makes Sense and What to Do Next
What Most Founders Get Wrong About Hiring Cost
A Series A SaaS founder budgets $110,000 for a data analyst and assumes that number represents the annual expense. The offer is approved, the headcount plan balances, and the hire looks affordable.
That model is incomplete. Employer compensation includes wages plus benefits and employer taxes, and BLS-based summaries report wages at about 70.7% of total compensation, with benefits and employer taxes accounting for about 29.3%. In other words, nearly one-third of employer spend sits outside base pay, as summarized by BLS-based employee cost guidance.
The $110,000 salary is therefore only the visible starting point. Add benefits, payroll taxes, equipment, recruiting, onboarding, and the output lost during the ramp, and the first-year commitment can move substantially higher. The exact result depends on the company, role, location, benefits plan, and hiring process, but the planning mistake is consistent: leadership approves the salary and discovers the rest later.
Practical rule: approve headcount against the employer's total cash and operating commitment, not the number printed on the offer letter.
A founder also pays for the time other employees spend interviewing candidates, defining requirements, reviewing early work, correcting metric definitions, and answering questions about the product. Those costs rarely appear in the requisition. They still reduce the team's capacity.
The same issue affects the expected return from the hire. An analyst who spends the first months reconciling Salesforce, Stripe, product analytics, and finance spreadsheets isn't producing mature decision support. The business pays for the seat while it waits for the reporting foundation to become trustworthy.
For leaders trying to fix that problem, the distinction between activity and decision quality is covered in this guide to data-driven leadership. The useful question isn't whether the company can afford a $110,000 salary. It's whether the company can afford the loaded cost, the management burden, and the opportunity cost of waiting.
What Fully Loaded Cost Actually Includes
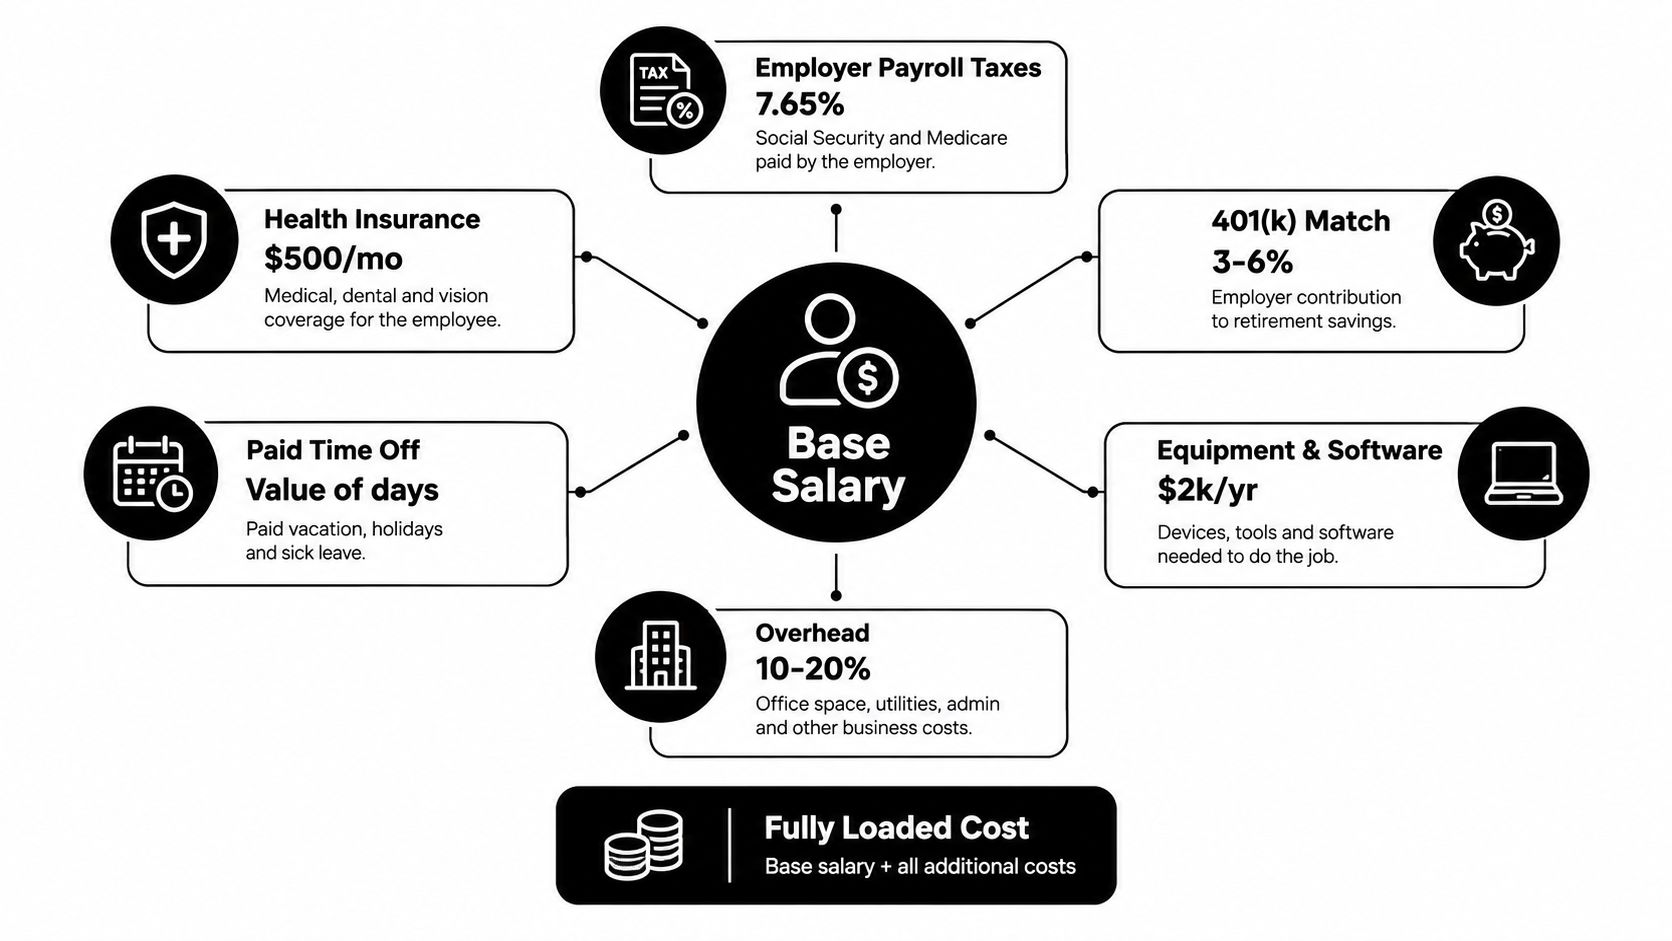
Fully loaded cost is the employer's total cost of employing someone. Base salary is the floor. Every other expense belongs in the model if the company incurs it because the person exists.
Start with mandatory employment costs
Payroll taxes come first. In the US, a common baseline for Social Security and Medicare is about 7.65%, before state unemployment taxes, benefits, and overhead, according to this fully loaded cost explanation. On a $100,000 salary, that baseline alone represents about $7,650.
Benefits add a second layer. Health coverage, retirement matching, paid time off, parental leave, and other benefits can be predictable recurring expenses. Employer retirement contributions may be a fixed policy percentage, while health coverage can vary by plan and employee election. Paid time off is also compensation, even though the employee isn't producing work during those days.
The employee cost breakdown from Sunbytes uses a practical range of 1.25x to 1.4x base salary for a standard loaded-cost model. It also explains why some businesses reach at least 2x salary when they fully allocate facilities, indirect costs, recruiting, and training.
Add the operating costs
The analyst needs a laptop, monitors, security controls, data tools, productivity software, and access to the company's reporting stack. The company may also allocate a desk, office services, IT support, HR administration, finance processing, and leadership management.
These aren't theoretical costs. A data hire may require access to a warehouse, a BI platform, a product analytics system, a CRM, a payment system, and collaboration tools. If the company already owns the licenses, the incremental cost may be low. If it doesn't, the new seat can expose a larger tooling decision.
Recruiting creates another bill. An agency fee is often calculated as a percentage of first-year salary, while internal recruiting still consumes interview hours and hiring-manager attention. Onboarding adds setup, training, documentation, and time from the people responsible for helping the new employee become effective. A founder evaluating executive or fractional support can use this fractional executive cost breakdown to think more clearly about labor cost beyond the headline rate.
Count the ramp
Ramp is the most neglected line. During the early months, the analyst is learning the schema, business model, metric definitions, stakeholders, and reporting cadence. The manager spends time reviewing work and supplying context instead of receiving finished analysis.
That lost capacity belongs in the first-year model. The employee may become highly valuable, but the business pays the full salary before it gets mature output. This is why year one and steady state should never be treated as the same cost.
The Real Math on a US Data Analyst Hire
A model is useful only if a founder can inspect the assumptions. The following examples use the specified worked structure to show how recruiting and ramp change the decision.
The first example starts with a $100,000 hire. Payroll taxes are modeled at 8%, benefits and insurance at 12%, equipment and software at $4,000, HR and finance overhead at 5%, recruiting at 20% of base salary, and ramp drag at 50% productivity loss during a four-month ramp.
| Cost Line | $100k Hire ($) | $70k Analyst ($) |
|---|---|---|
| Base salary | 100,000 | 70,000 |
| Payroll taxes | 8,000 | 5,600 |
| Benefits and insurance | 12,000 | 8,400 |
| Equipment and software | 4,000 | 3,500 |
| HR and finance overhead | 5,000 | 3,500 |
| Recruiting | 20,000 | 14,000 |
| Ramp drag | 16,667 | 11,667 |
| Year-one total | 165,667 | 116,667 |
| Loaded multiplier | 1.66x | 1.67x |
The $100,000 case lands at about $165,667 in year one. The $70,000 junior analyst lands at about $116,667. Lower salary doesn't remove the fixed work around hiring, and it doesn't eliminate the time required to learn the company's systems.
The result is deliberately more conservative than a salary-only plan. It treats recruiting as a real cash expense and ramp as a real productivity expense. The model isn't claiming that every company has identical benefits or recruiting costs. It shows why a first-year budget needs explicit lines for both.
A lower salary doesn't automatically create a lower-risk hire. A junior analyst may cost less in cash compensation while requiring more coaching, more review, and a longer path to independent output.
For a standard US employee, the commonly cited loaded range remains 1.25x to 1.4x base salary, as described in this US employee cost breakdown. The worked examples move higher because they include one-time recruiting and ramp drag in year one.
Year one is usually the worst cash and capacity period. Recruiting and onboarding arrive immediately, equipment and software are provisioned at the start, and the employee hasn't yet built enough context to operate independently. A founder who budgets only steady-state compensation will understate the first twelve months.
How Loaded Cost Varies by Role and by Year One
One multiplier doesn't fit every SaaS role. Benefits may be similar across employees, but compensation level, tooling, equipment, recruiting difficulty, and management requirements change the economics.
| Role | Base Salary Example | Year-One Loaded Cost | Steady-State Loaded Cost | Primary Driver of Difference |
|---|---|---|---|---|
| SaaS analyst | Base salary varies by level | 1.3x to 1.5x base | Lower than year one after recruiting and ramp | Data access, reporting tools, stakeholder context |
| Engineer | Base salary varies by level | 1.4x to 1.7x base | Lower than year one after hiring costs normalize | Benefits, equipment, recruiting difficulty, equity accounting |
| Operations hire | Base salary varies by level | 1.2x to 1.35x base | Lower than year one after setup costs normalize | Lower compensation and lighter tooling |
These role ranges are planning assumptions, not universal laws. An engineer with specialized recruiting needs can cost more to acquire and support than an operations hire. An analyst who owns a complex reporting environment may also require more tooling and management attention than the title suggests.
The first year carries the additional burden of recruiting, provisioning, onboarding, and reduced output. The steady-state figure removes some of those one-off costs, but it doesn't remove recurring taxes, benefits, software, equipment allocation, or management overhead.
Use two budgets, not one
Your headcount plan should show both the first-year landed cost and the recurring annual cost.
- Year one: Include recruiting, interview time, onboarding, equipment setup, software provisioning, and ramp drag.
- Steady state: Retain recurring salary, employer taxes, benefits, tools, overhead, and ongoing development.
- Replacement scenario: Model the cost again if the hire leaves, because recruiting and ramp repeat.
This separation gives the founder a useful answer to two different questions. “Can we fund the hire this year?” is a cash planning question. “Does this role make economic sense over time?” is a capacity and return question.
The right decision also depends on whether the role will receive enough high-value work after the initial reporting backlog is cleared. A full-time analyst can be financially sensible when demand is sustained and the company needs embedded context. It is a poor purchase when the business mainly needs reliable recurring dashboards and occasional analysis.
The Hidden Cost of Slow Decisions and Fragmented Reporting
The default reaction to unreliable reporting is often, “We need a data person.” Sometimes that's correct. Often the company first needs a dependable reporting system and a clear owner for metric definitions.
Without that foundation, the analyst becomes a human reconciliation layer. Leadership meetings turn into debates over which funnel number is correct. Growth teams launch experiments without clean readouts. Finance and RevOps rebuild board metrics in spreadsheets the night before the meeting.
Those failures create a tax on every decision. Leaders spend time checking numbers instead of discussing actions, teams delay decisions until someone can reconcile the data, and the same definitions get rebuilt in multiple places.
A practical centralized reporting system reduces that fragmentation conceptually by giving the organization one governed view of core metrics. It doesn't eliminate the need for judgment. It removes the repeated argument about whose spreadsheet is authoritative.
Where the drag shows up
Leadership time gets diluted. Executives repeatedly answer questions about definitions, filters, date windows, and source systems. That work displaces hiring, customer conversations, pricing decisions, and product direction.
Experiments lose their feedback loop. A growth test can launch on schedule while the measurement remains unclear. The team then makes the next decision without knowing whether the first one worked.
Board preparation becomes fragile. A last-minute spreadsheet may reconcile for one meeting and break when a source system changes. The risk isn't just embarrassment. Inconsistent metrics make the company look less controlled than it may be.
The expensive part isn't waiting for a dashboard. It's making important decisions with numbers nobody trusts.
The fully loaded cost of an analyst should therefore be compared with the cost of delayed decisions and fragmented reporting. Don't invent a productivity percentage to make this precise. Map the actual hours leaders spend reconciling reports, count recurring requests, and identify decisions that waited for data.
That audit usually reveals one of two situations. The company has enough repeatable demand to justify an embedded analyst, or it has a reporting reliability problem that a focused BI service can solve faster than a new employee can learn the business.
Hiring a Data Analyst vs a Done-For-You BI Service
A full-time analyst and a done-for-you BI service solve different problems. The employee builds internal context and can handle ongoing ad hoc work. The service should be judged on whether it delivers trusted reporting quickly, with a clear owner and defined accountability.
For the employee comparison, a $95,000 loaded analyst can become roughly $130,000 to $150,000 in year one after recruiting and ramp, based on the planning range supplied for this scenario. A done-for-you BI engagement is commonly positioned at $4,000 to $12,000 per month, with the exact scope determining the price. Those figures should be validated against an actual proposal, not treated as interchangeable products.
| Decision dimension | Internal analyst | Done-for-you BI service |
|---|---|---|
| Annual cost | Higher first-year commitment after salary, benefits, recruiting, and ramp | Recurring service fee matched to scope |
| Time to first insight | Slower while the hire learns systems and business context | Faster when the provider already has a reporting process |
| Accountability | Internal employee and manager | Contracted owner with agreed deliverables |
| Tooling ownership | Company buys and manages licenses | Provider may supply or manage parts of the delivery |
| Metric trust | Depends on governance and source reconciliation | Depends on validation, definitions, and service quality |
| Best fit | Sustained demand and embedded analysis | Reliable recurring reporting without full-time workload |
The service wins when the company needs a reporting outcome but doesn't yet have enough work for a full-time role. It also wins when the immediate problem is metric trust, because a provider can focus on source reconciliation, governed definitions, and repeatable dashboards rather than spending its early weeks learning internal career paths and team politics.
Read the broader perspective on outsourced business intelligence before treating an employee as the only serious option.
The break-even test
Hire internally once sustained reporting demand exceeds roughly 80 to 100 hours per month, the company has data engineering support, and leadership needs an embedded analyst for ad hoc work. Below that line, buying the outcome usually wins on speed and avoids paying for unused capacity.
The demand threshold matters because a full-time analyst isn't only a dashboard producer. The person needs meaningful recurring work, access to decision-makers, a manager who can prioritize requests, and an environment where the data stack won't remain permanently broken.
A service also isn't magic. It needs access to source data, decisive stakeholders, and agreement on the metrics that matter. But those requirements exist for an employee too. The relevant question is which option creates trusted answers sooner and at a cost the business can sustain.
When Hiring Makes Sense and What to Do Next
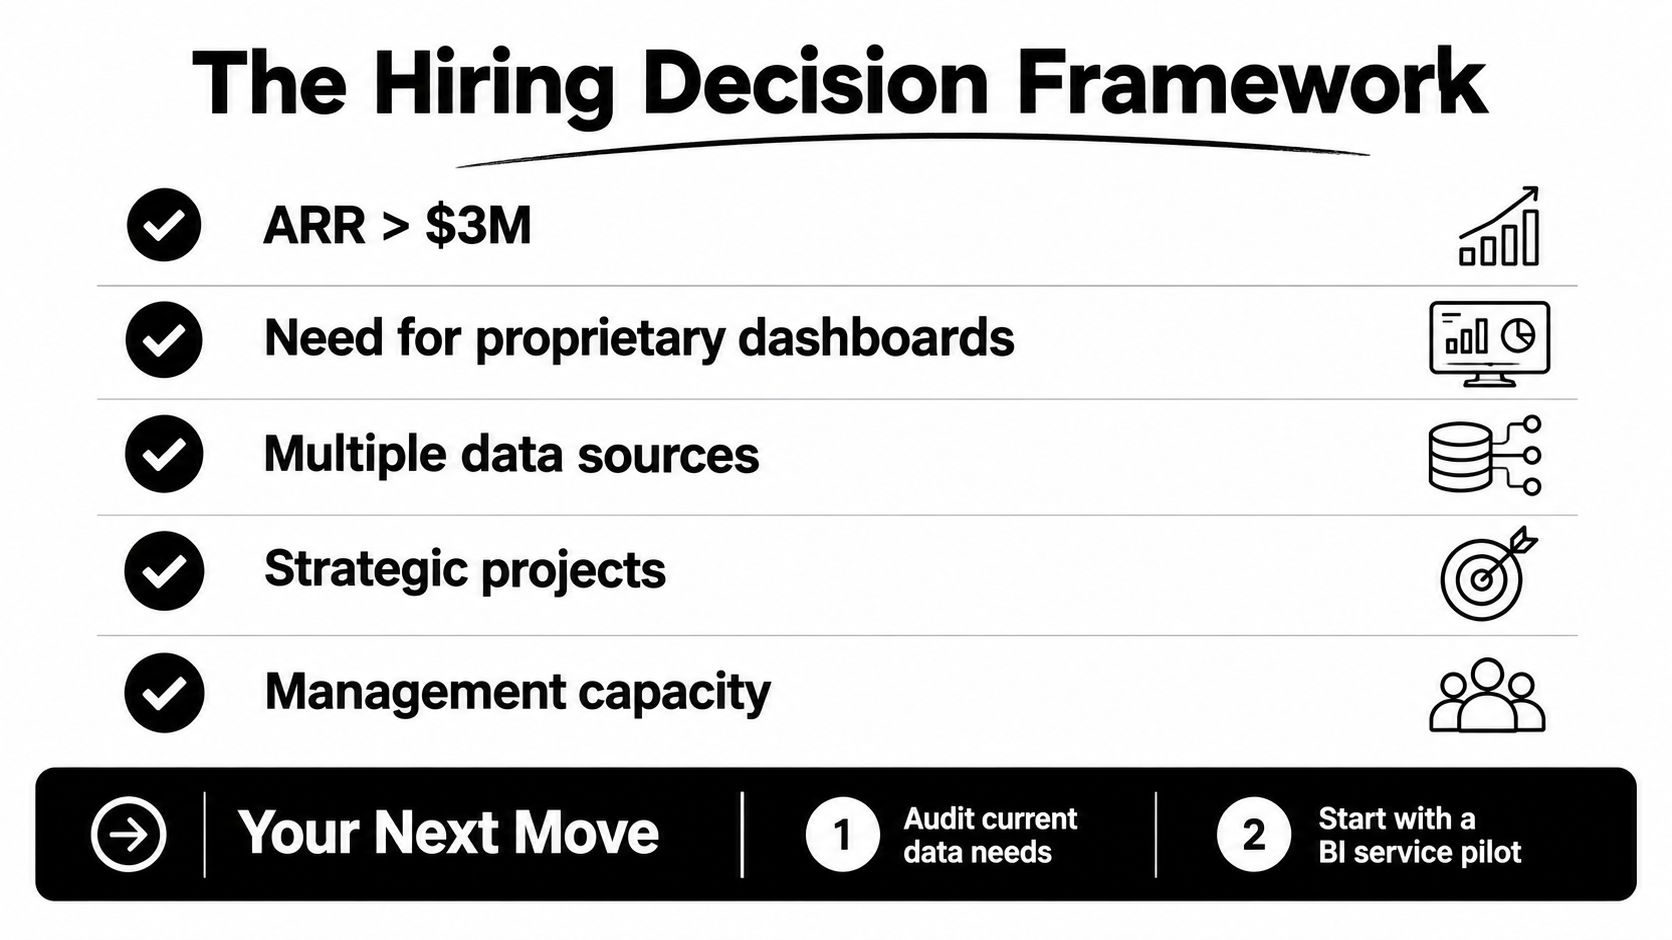
A full-time analyst makes sense when the company has sustained analytical demand, stable data ownership, and leaders who will use the output consistently. Don't hire because dashboards feel embarrassing. Hire when the business has enough recurring decisions to keep an embedded operator busy and enough infrastructure to let that operator succeed.
Use this binary checklist:
- Stable ARR: Can the company fund the role without putting core operating commitments at risk?
- Dedicated data stack ownership: Is someone responsible for the warehouse, permissions, integrations, and data quality?
- A manager already in place: Who will prioritize requests, review work, and protect the analyst from random executive interruptions?
- Three repeatable reporting workflows: Can you name at least three recurring workflows that need the same answer every week or month?
- No faster alternative: Has the company tested whether an external service can solve the immediate reporting problem sooner?
The first criterion is financial. The second is operational. The third determines whether the hire will have direction. The fourth separates a real role from a temporary backlog. The fifth prevents the company from converting an urgent reporting problem into a lengthy recruiting project.
Hire for sustained analytical demand. Buy for an urgent trust and reporting problem.
Map the last 90 days of ad hoc reporting requests and tally the hours spent producing, checking, and explaining them. Compare that workload with the loaded cost of the analyst you want to hire, then account for the management capacity and data engineering support the role requires.
A done-for-you BI pilot is the safer starting point when reporting demand is uneven, definitions conflict across systems, or leadership needs reliable dashboards before it can justify a permanent seat. HelpWithMetrics offers managed BI for companies without a data team, including governed reporting and an AI-answerable semantic layer that lets operators ask plain-English questions against trusted business definitions.
Book a 30-minute cost-modeling session and bring your target salary, current reporting workload, and the last few recurring dashboard requests. We'll calculate the hire-versus-buy economics and give you a written go-or-buy recommendation.
HelpWithMetrics gives companies without a data team dependable dashboards, governed metrics, and plain-English answers without forcing an early full-time analyst hire. Visit HelpWithMetrics to book a call and get a free first dashboard tied to your actual reporting needs.