You're ten minutes from a board meeting. Salesforce shows one revenue number, Stripe shows another, and the finance spreadsheet has a third. Everyone has a plausible explanation, so the meeting turns into a reconciliation exercise instead of a discussion about growth, hiring, or cash.
That isn't primarily a spreadsheet problem. It's a data reliability problem. Your company lacks a dependable way to determine whether a metric is complete, accurate, consistently defined, and fit for the decision in front of you.
For founders, COOs, and RevOps leaders, the practical question isn't “Is our data clean?” Perfect data doesn't exist. The better question is, “Is this metric reliable enough for board reporting, forecasting, or an AI-generated answer?” The threshold changes with the use case. A small timing difference may be acceptable in a planning conversation, but the same ambiguity can undermine a board report or cause an AI system to produce a confident but incorrect recommendation.
This distinction matters because unreliable metrics consume operating capacity. Teams reconcile reports, explain conflicting definitions, rebuild dashboards, and second-guess decisions that should have been routine. The problem gets more expensive as your company adds systems, channels, products, and reporting requirements.
The guidance below defines what is data reliability in practical business terms, identifies the failure modes behind conflicting metrics, and gives you a decision framework for fixing trust without rushing into an expensive first data hire. By the end, you should be able to tell whether your company needs better ownership, a semantic layer, stronger governance, or a documented explanation for acceptable reporting noise.
Table of Contents
- Introduction: Why Your Numbers Never Match
- What Data Reliability Really Means for Business Decisions
- The Three Dimensions That Make Data Trustworthy Over Time
- Why Metrics Drift and How Common Failure Modes Break Trust
- The Business Cost of Unreliable Metrics
- How to Measure Trust and Deliver Audit Ready Metrics Without DIY Fixes
- Getting to Reliable Metrics in 30 Days Without Hiring a Data Team
Introduction: Why Your Numbers Never Match
The founder opens the CRM and sees closed-won revenue. The COO checks billing and sees recognized invoices. Finance applies a different date rule in its reporting workbook. Every record may be valid, yet the three reports answer different business questions.
Board preparation exposes the problem. One leader says revenue is down; another says it is up. A third notes that one report includes expansions while another waits until billing begins. Hours disappear into an argument over which number is “right,” when the issue is that nobody defined which number fits the decision.
Operating reality: A metric can be technically correct and still be unreliable for the way your team uses it.
The U.S. Government Accountability Office's guidance on data reliability defines reliable data as reasonably complete and accurate for its intended use, with protection against inappropriate alteration. That standard belongs in operating leadership, not only in IT. It sets a practical threshold for deciding whether a metric is safe to use.
A revenue figure for the board needs a stable period definition, documented treatment of refunds and expansions, and a result another person can reproduce. An AI assistant needs those controls plus clear provenance and shared semantic meaning. A fluent answer that blends CRM pipeline with billing revenue creates false confidence and can drive the wrong action.
The cost appears in routine work. Analysts reconcile spreadsheets instead of examining performance. RevOps revises dashboards after each dispute. Finance adds manual checks before reporting cycles. Founders lose confidence in the numbers and manage from anecdotes.
Reliability is a decision-risk threshold, not a cleanliness contest. Acceptable noise depends on the use case. A minor timing difference may be tolerable in internal planning, while conflicting definitions in board reporting require ownership, governance, and often a semantic layer. AI answers face the same standard: unresolved metric conflicts should block confident output, not disappear behind polished language.
This guide identifies when reporting noise is acceptable and when it demands correction. The goal is not perfect data across every system. It is reproducible, owned, fit-for-purpose metrics for material decisions.
What Data Reliability Really Means for Business Decisions
A reliable metric gives leaders a defensible basis for action. It is reasonably complete, accurate enough for its intended use, and protected from changes that weaken its meaning or provenance. That is the audit-grade starting point introduced in the previous section.
In practical terms, reliability means your team can use a number for a stated purpose and reasonably expect it to reflect reality, contain the records that matter, and withstand scrutiny about how it was produced.
Reliability is fitness for a decision
A financial ledger is useful only when it contains the right entries, records correct values, applies consistent rules, and provides enough documentation for another person to understand the result. Metrics follow the same standard.
Evaluate every important metric through four questions:
- Purpose: What decision will this metric support?
- Coverage: Are the records that could change the decision included?
- Meaning: Do the values represent the business concept that the label implies?
- Reproduction: Can another person produce the same result with the same rules?
A monthly board revenue figure may allow a documented close adjustment. It cannot allow an unexplained change in inclusion rules between reporting periods. A real-time automation may need fresher data than a monthly planning metric. An AI answer needs a semantic definition that separates booked, billed, and recognized revenue before it can respond safely.
The standard is conditional. “Is this data perfect?” rarely helps leaders decide. “Is this data reliable enough for this decision?” sets the threshold that matters.
Why clean dashboards still fail
A polished dashboard can conceal missing records, duplicate customers, stale refreshes, or transformations that changed the original meaning. The chart may load without an error while the metric remains unsuitable for forecasting, board reporting, or an AI-generated answer.
That distinction matters at the executive level. Minor timing noise may be acceptable for internal planning. Conflicting definitions in board reporting require an accountable owner, governance, and often a semantic layer. AI systems need the same control. They should not turn unresolved metric conflicts into confident language.
A reliable reporting environment provides more than a displayed value. It provides a defined metric, a source hierarchy, and enough provenance to explain why the number is what it is. Without that context, a dashboard creates the appearance of control while leaving decision risk unresolved.
The Three Dimensions That Make Data Trustworthy Over Time
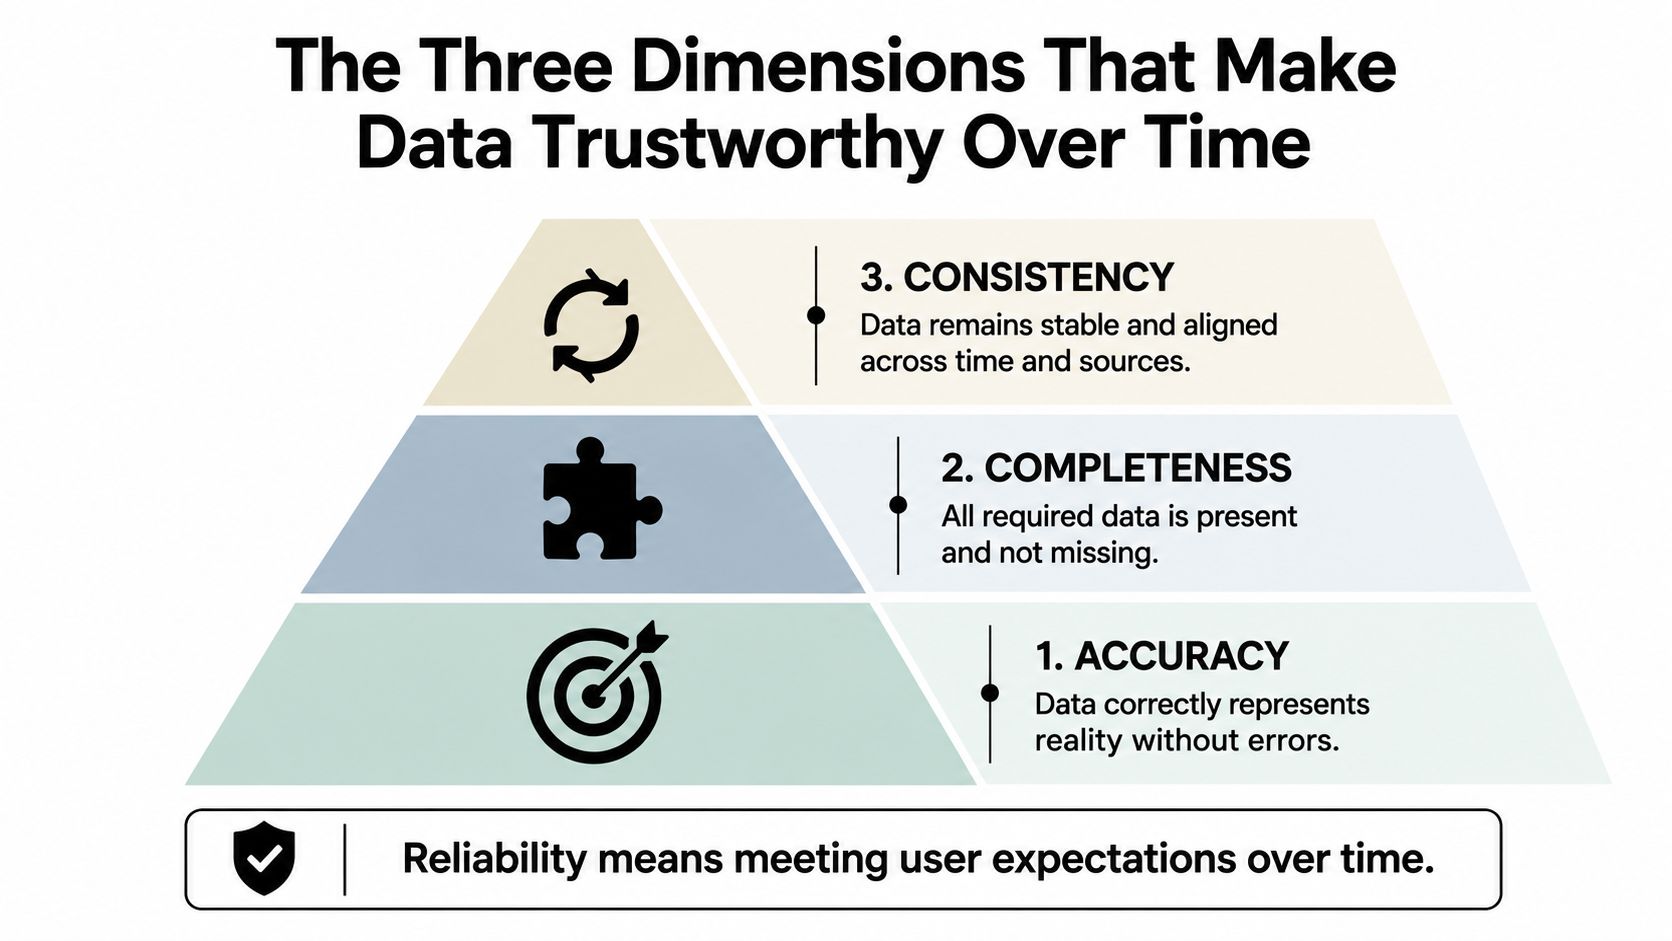
Data reliability depends on more than a one-time cleanup. It's a property of the full path from source record to business interpretation. The core dimensions are accuracy, completeness, and consistency, and each one protects against a different type of decision failure.
Accuracy reflects business reality
Accuracy asks whether the recorded value matches the real-world event. If a contract was expanded but the CRM still shows the old amount, the record is inaccurate. If a customer is marked churned while billing remains active, the resulting churn analysis is also inaccurate.
Accuracy can fail at entry, during integration, or in transformation. A correct source value may become misleading after a pipeline applies the wrong currency rule or maps a product category incorrectly. That's why reliability belongs to the end-to-end pipeline, not just the source application.
Completeness protects the denominator
A report can contain accurate records and still produce a bad decision if critical records are missing. Missing opportunities can make win rates look stronger. Missing cancellations can make churn appear lower. Missing implementation costs can make gross margin look healthier than it is.
Completeness depends on purpose. A finance report may need every invoice and credit note. A campaign report may only need tagged leads from a defined channel. Leaders should identify which omissions would change the decision, rather than demanding exhaustive coverage for every metric.
Consistency makes trends usable
Consistency means a metric remains aligned across sources and over time. A definition shouldn't change because a new analyst rebuilt the dashboard, a CRM field was renamed, or a refresh schedule moved.
IBM's explanation of data reliability emphasizes that reliable data should meet user expectations over time and remain intact, or change only through documented processes and integrity checks. That requirement is operationally important. Leadership needs to compare periods using stable definitions, not reconstruct the meaning of each chart every week.
Practical rule: If a metric changes because its definition changed, the report must show that change. Silent definition drift is a reliability failure.
Consistency also includes provenance. Teams need to know which system wins when sources disagree, which transformations occurred, and whether a refresh completed as expected. Those details become especially important when AI systems answer questions in plain English. For teams building trustworthy AI for customer support, reliable upstream data and clear interpretation rules are prerequisites for answers customers can safely use.
Why Metrics Drift and How Common Failure Modes Break Trust
The weekly metrics meeting usually starts with a familiar sentence: “Why doesn't this match the other report?” The answer often isn't fraud, incompetence, or a broken dashboard. It's a collection of reasonable local decisions that no one has governed globally.
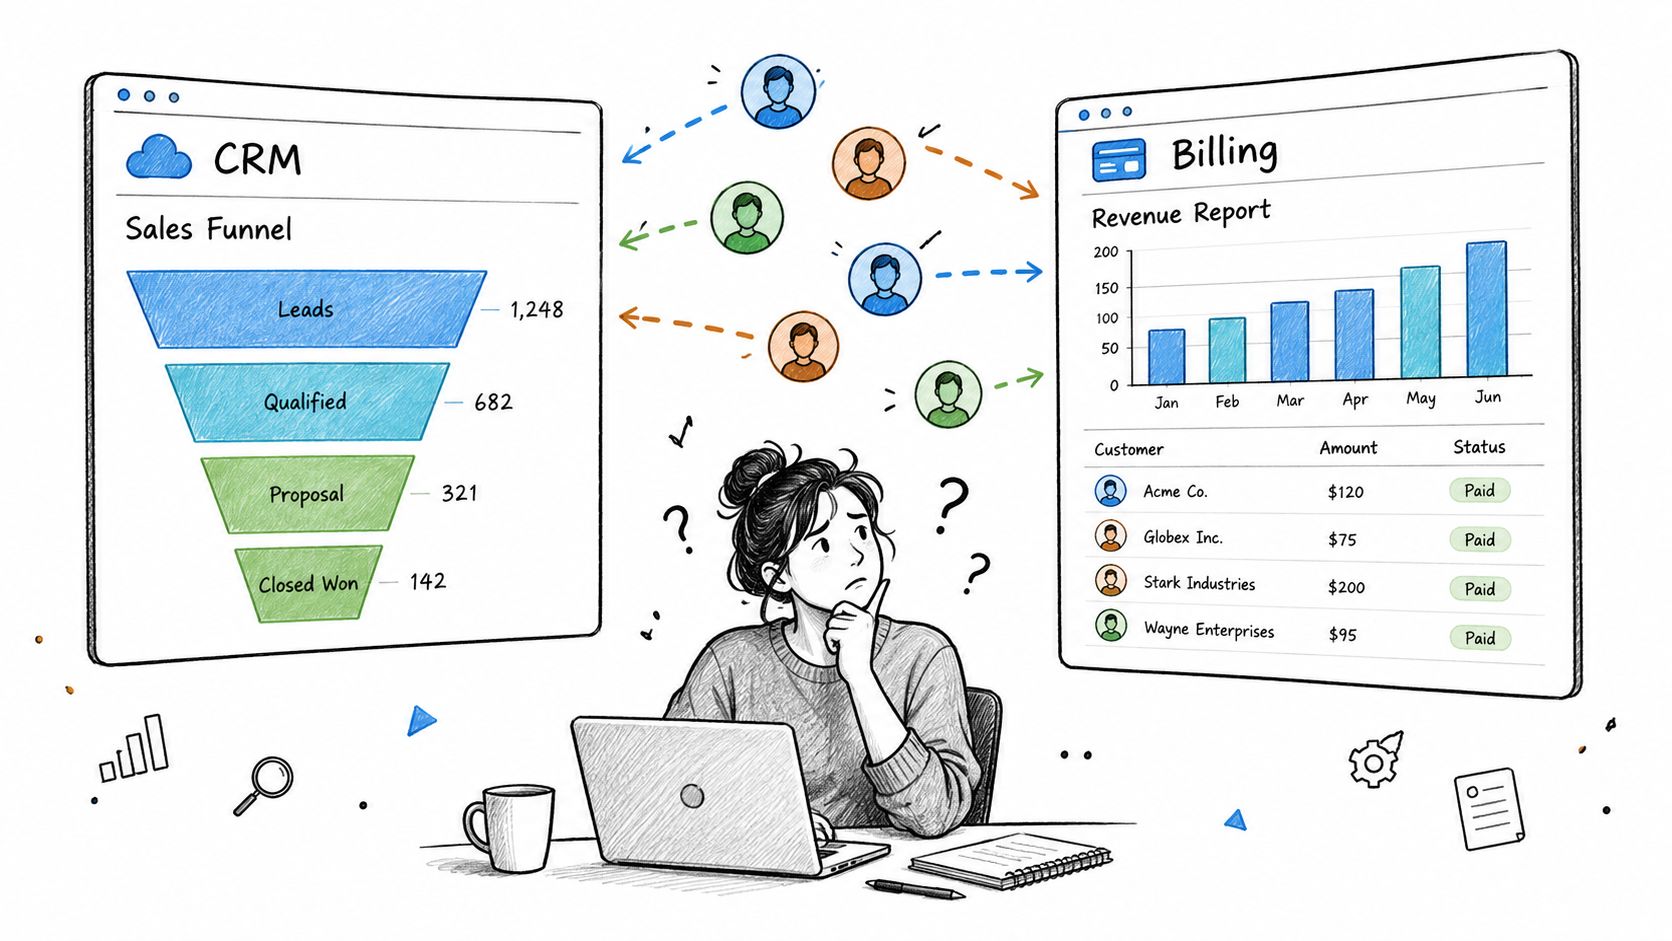
A SaaS company may create an account in Salesforce, a customer record in Stripe, and a workspace in its product database. If those records aren't linked consistently, the company can count one customer more than once or fail to connect expansion revenue to the correct account. Each system looks internally coherent. The cross-system metric isn't.
The common sources of drift
Marketing and sales often assign credit differently. Marketing may report leads by first touch, while sales reports opportunities by the most recent campaign interaction. Neither view is automatically wrong. The conflict becomes a business risk when leaders use both numbers to judge channel efficiency without stating the attribution model.
Revenue definitions drift in the same way. One team calls ARR the value of active subscriptions. Another includes signed contracts that haven't started. A third includes expansion opportunities still in negotiation. The label remains “ARR,” but the business meaning changes.
Other failures appear in less visible places:
- Duplicate entities: Multiple records represent the same customer, opportunity, or subscription.
- Source precedence conflicts: Finance trusts billing, while RevOps trusts the CRM, with no agreed rule for resolving differences.
- Timing mismatches: Systems refresh on different schedules, so teams compare a current pipeline view with an older billing snapshot.
- Transformation changes: A query, dashboard, or spreadsheet applies a new filter without documenting its effect.
The result is predictable. The board asks a simple question, and the team answers with a debate. A useful overview of data integration challenges helps explain why combining systems creates reliability risks even when every individual tool appears healthy.
Noise versus systemic risk
Not every mismatch requires a governance project. A small timing difference may be acceptable when the decision is directional and the source is known. It becomes systemic risk when the discrepancy changes the decision, recurs without an owner, or prevents independent reproduction.
That's the dividing line. Acceptable noise is explained and bounded. Unreliable data is unexplained, material, or persistent. If your team can't state which system controls the metric and why, the issue deserves ownership before another dashboard gets built.
The Business Cost of Unreliable Metrics
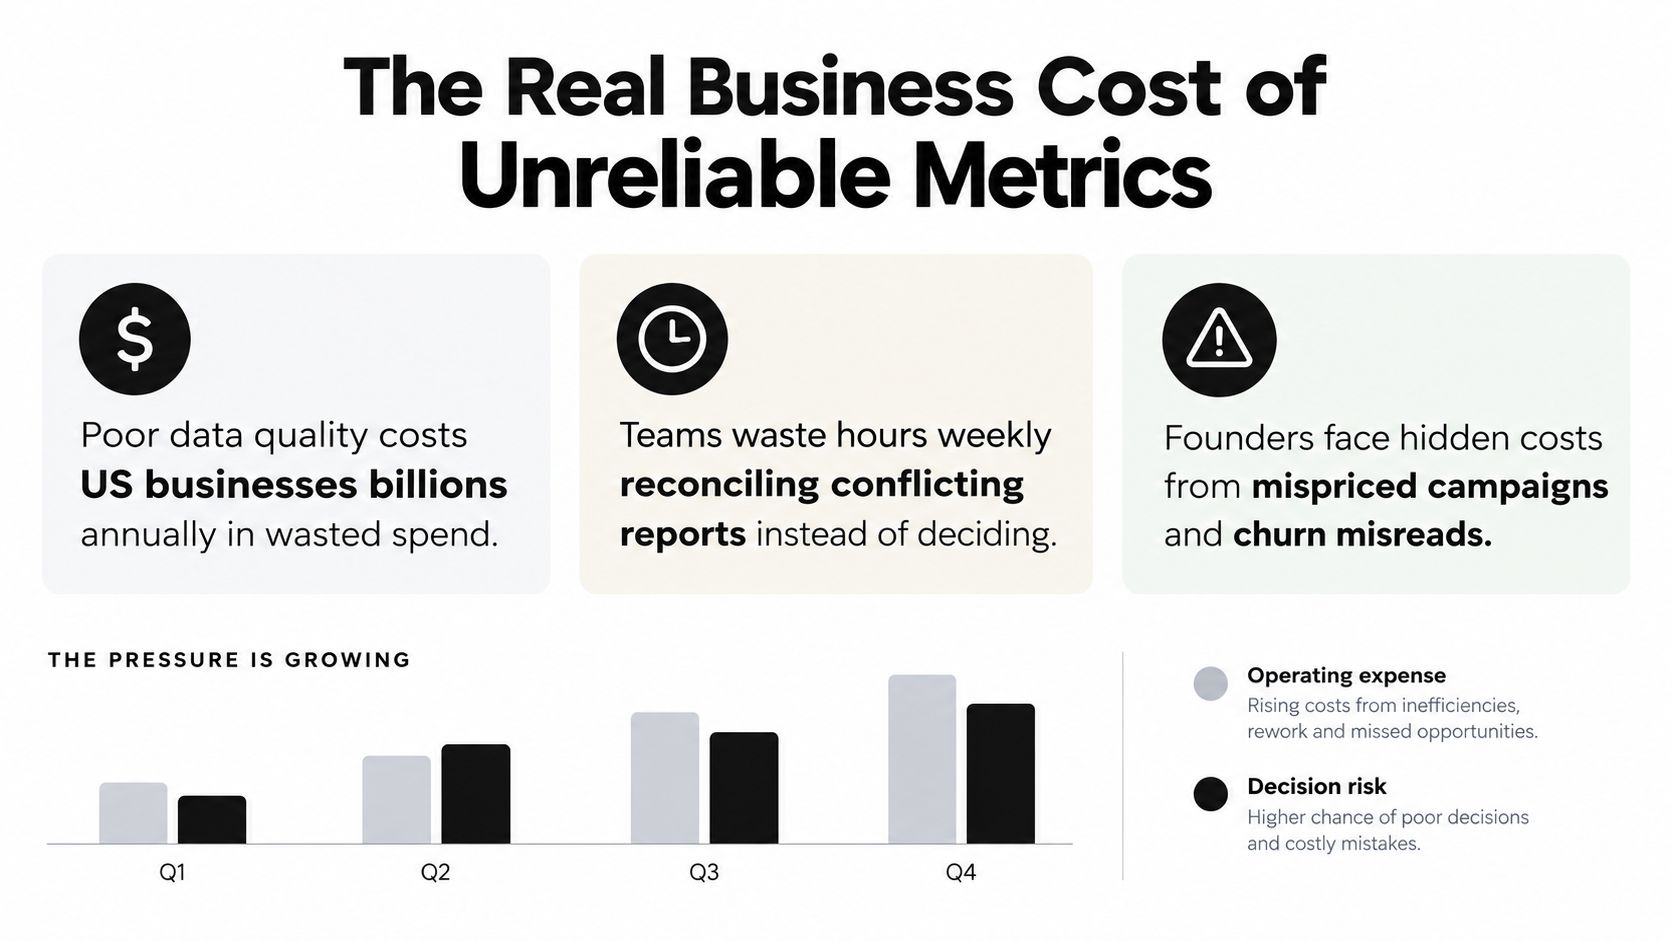
Poor data quality is an operating expense disguised as analysis. IBM estimates that it costs the U.S. economy $3.1 trillion annually, while Gartner-reported figures put the average organizational cost at about $12.9 million per year, as summarized by IBM's analysis of the cost of poor data quality. Founders experience that cost through repeated decisions that require investigation before anyone can act.
An analyst spends days reconciling a board pack. A hiring plan relies on an inflated forecast. A growth team funds the wrong channel because attribution is inconsistent. A churn report hides cancellations until the next billing cycle. These are decision costs, not dashboard defects.
The cost scales with complexity
IBM's 2025 research found that 43% of chief operations officers ranked data quality issues as their most significant data priority. More than a quarter of organizations lose over $5 million annually because of poor data quality, and 7% lose $25 million or more. IBM's 2025 research sharpens the picture for operators.
For a growing company, the pattern is direct. More systems create more joins. More products create more definitions. More go-to-market motions create more attribution rules. Without clear ownership, every new source increases reconciliation work and raises the chance that board reporting or an AI answer crosses a decision-risk threshold.
The right response depends on the consequence. A minor discrepancy may be acceptable for directional planning when its source and limits are documented. Conflicting numbers that alter a board decision, recur without an owner, or prevent independent reproduction require governance and a semantic layer.
Executive test: If your board reporting requires a private explanation of how every number was assembled, the report isn't audit-ready yet.
Unreliable metrics also create opportunity costs. Operators delay decisions while investigating discrepancies. Managers add approval layers because automated reports lack credibility. Teams export data into spreadsheets, creating another uncontrolled version of the truth.
The financial case for reliability is less rework, fewer conflicting decisions, and greater confidence that management attention stays on the business rather than the reporting machinery.
How to Measure Trust and Deliver Audit Ready Metrics Without DIY Fixes
Leaders can judge metric reliability without becoming data engineers. Start with the decision, then test whether the metric survives three practical checks: reproducibility, stability, and fitness for use.
Reproducibility means two qualified people can obtain the same result from the same approved sources and definitions. Stability means the result doesn't change unexpectedly between refreshes. Fitness means the metric contains the freshness, completeness, and provenance required by the workflow.
A board report and a real-time AI answer have different thresholds. Treating them as interchangeable creates unnecessary cost in some areas and unacceptable risk in others.
A decision threshold for common use cases
| Use Case | Reliability Threshold | What Breaks Trust |
|---|---|---|
| Board reporting | Stable definitions, complete material records, documented adjustments, and reproducible results | Silent changes to period logic, unexplained source conflicts, or missing material transactions |
| Revenue forecasting | Consistent pipeline stages, clear ownership, and a known relationship between forecast inputs and realized revenue | Stage definitions that vary by team, stale records, or duplicate opportunities |
| AI answers for executives | A governed semantic layer, source precedence, provenance, and definitions the system can apply consistently | Ambiguous metric names, unsupported joins, stale data, or answers that can't show their source |
| Real-time automation | Freshness appropriate to the action, intact transformations, and monitoring for abnormal changes | Delayed events, partial loads, drift, or altered records without an audit trail |
The right fix is usually not another visualization tool. It's an operating model that establishes metric definitions, source precedence, ownership, and traceability. A semantic layer gives business terms a stable meaning so “net revenue retention” doesn't produce different logic in finance, RevOps, and an AI assistant.
Why tool sprawl and DIY hiring disappoint
Adding Looker, Tableau, Power BI, or another warehouse rarely resolves an ownership problem. Those products can present data effectively, but they won't decide whether billing or the CRM is authoritative for a particular metric.
A first data hire can help, but a single person may inherit fragmented systems, undocumented logic, and pressure to deliver dashboards before the foundation is defined. That creates a risk of institutionalizing inconsistent metrics faster.
Teams evaluating ingestion and monitoring should also find the right extraction pipeline tool for their source environment. The tool matters, but it's subordinate to the definitions and accountability that determine whether the output can support a decision. For a broader view of monitoring concepts, see data observability.
Getting to Reliable Metrics in 30 Days Without Hiring a Data Team
For a company with 20 to 200 employees, the bottleneck usually isn't a lack of dashboard software. It's the absence of agreed definitions, system precedence, and accountable owners. Buying another tool before resolving those questions gives the organization another place to disagree.
Use a decision-first standard:
- Board metrics: Every material number has an owner, definition, source, and reproducible logic.
- Forecast metrics: Pipeline stages and timing rules connect clearly to the outcome being forecast.
- AI-queryable metrics: Plain-English questions map to governed business terms, not improvised field combinations.
- Operational metrics: Refresh expectations and known exceptions are visible to the people acting on the data.
- Change control: Definition changes are documented so trend breaks can be explained.
A single source of truth for data isn't necessarily one physical database. It's one governed interpretation of the business, with clear rules for which systems contribute which facts.
HelpWithMetrics provides a done-for-you agentic BI service for companies without an in-house data team. Its model combines connected sources, a semantic layer, documented metric definitions, and auditable dashboards and answers, with delivery targeted within 30 days for a flat $5K per month service.
You don't need to make every dataset perfect before acting. You need to identify the decisions where unreliable data creates material risk, then establish enough governance and provenance to make those decisions defensible.
HelpWithMetrics can connect your key systems, define the metrics your board and operators use, and deliver a governed dashboard and AI-answerable foundation within 30 days. Book a call with HelpWithMetrics to discuss your reporting gaps and receive a free first dashboard.