It's Friday afternoon. Your CRO is showing record pipeline, your CFO is asking why conversion efficiency hasn't improved, and the latest brand tracker says perception is slipping. Both dashboards have credible owners. Both use recent data. Neither explains the contradiction.
This is the point where brand health becomes a commercial problem, not a marketing presentation. A tracker can report stronger awareness while the CRM shows weaker win rates. Customer sentiment can improve while renewal risk rises. Share of voice can expand because of a controversy. The executive team doesn't need another scorecard. It needs to know which perception changes are connected to pipeline, retention, and pricing power, and which ones the CRM is right to ignore.
The framework below focuses on five working KPIs, a growth-stage prioritization map, a credibility test for measurement vendors, and a board format that can survive cross-examination. It won't list every metric in your MarTech stack or reopen the brand-versus-performance argument. The useful question is narrower: which brand health metrics help you make a better commercial decision?
Table of Contents
- When Your Brand Tracker Starts Fighting Your CRM
- The Five Core Brand Health KPIs Explained
- Which Brand Health Metrics Matter at Each Growth Stage
- The Vanity Trap and the Better Diagnostic Question
- What Trustworthy Brand Health Measurement Requires
- Connecting Brand Perception to Revenue and Trust
- Surfacing Audit-Ready Brand Metrics for Boards
When Your Brand Tracker Starts Fighting Your CRM
The founder has a forty-page tracker open on one screen and Salesforce on the other. The brand report says consideration is healthy, the marketing team has increased category visibility, and sentiment looks stable. The CRM says sales cycles are stretching, late-stage opportunities are stalling, and expansion conversations are becoming harder.
The instinctive response is to pick a winner. That's a mistake. The tracker and CRM are measuring different parts of the buying system. Survey data captures memory, associations, confidence, and stated intent. CRM data captures what buyers and customers did inside your sales and service processes. Neither is sufficient on its own.
Brand health has always rested on measuring what people remember, associate, and recommend. Early brand research linked to George Gallup's “Top of Mind” work in the 1930s and Louis Cheskin's “Association Test” in the 1940s established the basic logic that still underpins modern tracking, as described in the history of brand awareness research. Contemporary frameworks now include awareness, consideration, purchase intent, satisfaction, quality, value, recommendation, and word of mouth.
The operational question is whether those perceptions show up in commercial behavior.
Board-level test: Every brand metric needs an owner, a decision, and a known relationship to a commercial outcome.
Start by reconciling definitions. “Consideration” might mean a respondent recognizes your name, while the sales team uses it to mean a qualified account has entered an active evaluation. “Retention” might mean a contract renewed, while the survey asks whether a customer feels positive about the brand. Those are related signals, not interchangeable facts.
Then reconcile timing. A brand campaign may affect memory before it affects branded search, direct traffic, opportunity creation, or renewal behavior. If the tracker and CRM use different windows, segments, or populations, a conflict may be a timing issue rather than a data-quality issue. Teams that also rely on paid and owned channel data should understand the role of server-side tracking for marketers when validating behavioral signals across platforms.
The goal isn't to force every brand movement to explain last quarter's revenue. The goal is to identify the perception shifts that deserve investment because they improve the odds of future demand, conversion, retention, or pricing.
The Five Core Brand Health KPIs Explained
Treat each KPI as a decision instrument. If a number doesn't change what marketing, sales, product, or customer success does next, it probably doesn't belong on the primary dashboard.
Awareness and memory
Unaided awareness asks which brand comes to mind first in a category. Aided awareness asks whether people recognize the brand when prompted. Unaided recall is closer to mental availability, while aided recognition tells you whether your message reaches people who may not retrieve the brand spontaneously.
A SaaS operator uses the split to judge demand-generation quality. If aided awareness rises but unaided recall remains flat, the budget may be improving recognition without building category memory. That can justify testing broader positioning, not just increasing retargeting spend.
Consideration set inclusion
Consideration asks whether the brand makes the buyer's shortlist before detailed evaluation begins. This is more commercially useful than awareness because it places the brand inside the decision frame. A buyer who knows you exist but never considers you won't create pipeline.
If consideration falls among target accounts while traffic remains stable, shift budget toward category education, proof, and differentiation. Don't celebrate a traffic increase that brings visitors who were never viable buyers.
NPS and sentiment
NPS measures recommendation intent. The score matters less than the reasons behind it. Read promoter and detractor verbatims for recurring themes around reliability, onboarding, support, value, or product fit.
A B2B operator should connect those themes to renewal cohorts and expansion behavior. If detractors repeatedly mention implementation friction before product usage data shows a decline, customer success has an earlier intervention point. Teams needing a clear reference for interpreting the measure can use this guide to NPS benchmarks.
Share of voice
Share of voice is your earned, paid, and social presence relative to the category conversation. It becomes useful when paired with sentiment, topic, audience, and share of market. A spike in mentions may represent demand, a campaign, or a problem.
Use it to make a channel decision. If your share of voice is weak in the buyer segment that matters, invest in the publications, communities, search topics, and events that influence that segment. Don't optimize raw mention volume. A clear message also needs consistent execution, which is why teams refining positioning may benefit from guidance on how to turn a tagline into a consistent brand.
Retention overlap
Retention overlap connects stated brand value with actual renewal. Ask renewing customers what influenced the decision, then measure how often they cite the brand, its promise, trust, or differentiation without prompting. Compare the responses with CRM renewal and expansion records.
If retained customers repeatedly mention confidence in your category expertise, that's evidence for protecting the positioning. If renewals happen despite weak brand association, product utility may be doing the work and brand investment may need a different objective.
| KPI | Question It Answers | Data Source | Commercial Action |
|---|---|---|---|
| Awareness | Do buyers remember or recognize us? | Survey, branded search, direct traffic | Adjust reach and category education |
| Consideration | Are we on the shortlist? | Survey, opportunity research, comparison behavior | Improve differentiation and proof |
| NPS and sentiment | Why do customers recommend or resist us? | Survey verbatims, reviews, support feedback | Prioritize retention and experience fixes |
| Share of voice | Are we present in the right category conversations? | Media, search, paid, and social data | Reallocate visibility investment |
| Retention overlap | Does the brand influence renewal? | Renewal survey matched to CRM | Protect or change positioning and customer messaging |
Which Brand Health Metrics Matter at Each Growth Stage
Measurement should become more selective as the company grows. More revenue doesn't justify more KPIs by default. It just creates more decisions that may need evidence.
For an early startup under $10M ARR, with one primary segment, lead with consideration set inclusion and retention overlap. Consideration tells you whether the right buyers are willing to evaluate the product. Retention overlap tells you whether the promise survives contact with the customer experience.
At this stage, broad aided awareness is usually a weak allocation guide. Track it less frequently, potentially biannually, while using interviews and win-loss evidence to understand why target buyers choose or reject you. NPS can be useful directionally, but small samples make overall scores fragile. Share of voice against established incumbents tells you little unless the conversation is filtered to your actual buyer segment.
For a scale-up between $10M and $100M ARR, the buyer pool is widening and channel efficiency is under pressure. Aided awareness, consideration, and share of voice become more important because the company needs to enter new segments and maintain visibility while existing demand channels become less efficient. Retention overlap remains critical. Growth built on new logo acquisition can conceal a brand promise that fails during onboarding or renewal.
For a growth-stage company above $100M ARR, operating across products or regions, segment-level sentiment, NPS verbatims, awareness, and share of voice deserve board attention. Overall NPS should be retired as the headline if it hides movement among strategic segments. A stable aggregate score can conceal worsening detractor themes in a major market or buyer role.
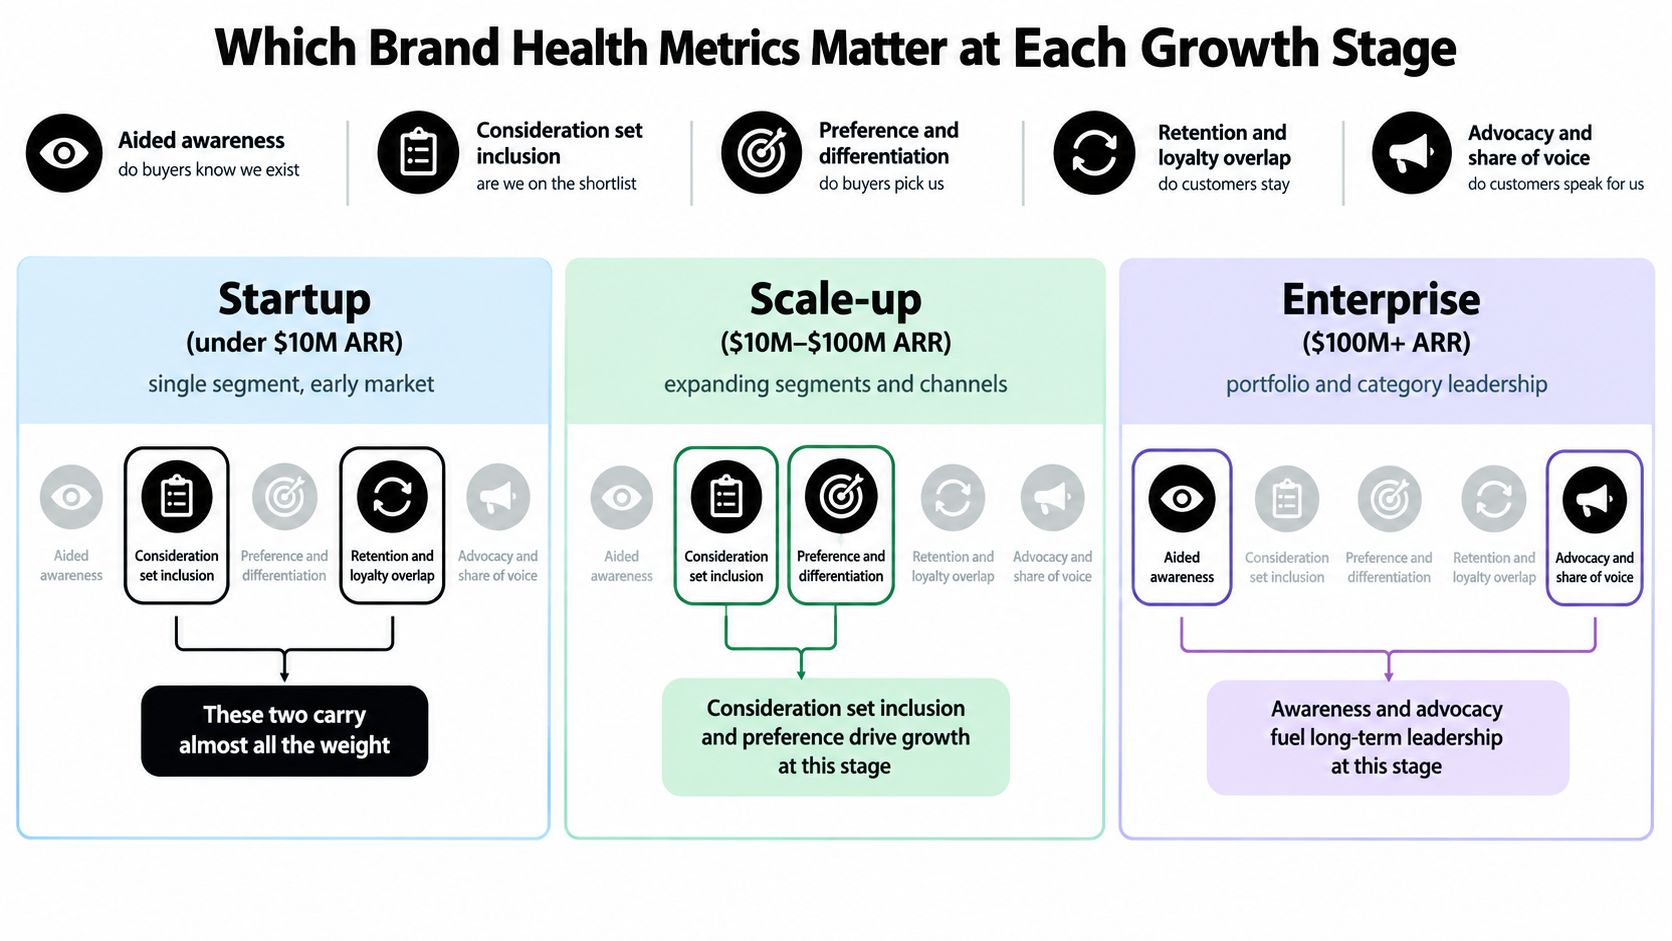
| Growth stage | Dominant metrics | Deprioritize |
|---|---|---|
| Startup | Consideration, retention overlap | Frequent aided awareness and broad share of voice |
| Scale-up | Awareness, consideration, retention overlap | Unsegmented sentiment |
| Enterprise | Segment sentiment, advocacy, awareness | Overall NPS as the main conclusion |
The measurement budget should scale with the decision it informs. A startup doesn't need an enterprise tracker. An enterprise shouldn't use a startup dashboard that hides regional and segment differences.
The stage logic also protects teams from false precision. Ask fewer questions, but make each answer relevant to a budget, product, sales, or customer decision.
The Vanity Trap and the Better Diagnostic Question
A brand can clear an unaided awareness above 70% threshold and still lose deals, renewals, and pricing power. High recognition shows that buyers remember the name. It does not show preference, differentiation, sales effectiveness, or willingness to pay. Treat the threshold as an illustrative ceiling, not a commercial result.
The expensive mistake is reporting perception as if it were revenue. A famous brand can remain interchangeable, dominate category memory, and attract attention from people who will never buy. Meanwhile, the buying committee that controls the contract may barely recognize it.
Replace “Is awareness climbing?” with the board-level question:
Which perception move would change next-quarter pipeline, retention, or pricing power?
Test every KPI against three filters:
- Pipeline connection: Does movement align with opportunity creation, sales velocity, stage progression, or win rate?
- Churn warning: Does the metric identify risk before product usage, support volume, or renewal probability deteriorates?
- Spend sensitivity: Does the metric respond when you change the message, channel, audience, or investment?
A KPI that fails all three filters is reporting theater. One that passes a single filter can still serve a narrow operating decision, but it should not lead the board narrative. A KPI that passes all three belongs in planning, investment reviews, and executive reporting.
| KPI | Predicts Pipeline? | Predicts Churn Early? | Moves With Spend? |
|---|---|---|---|
| Broad awareness | Sometimes, when the audience matches the ICP | Rarely on its own | Often |
| Consideration | More directly than recognition | Not usually | Yes, when messaging reaches the right segment |
| NPS verbatims | Indirectly | Often, when themes are specific | Not necessarily |
| Share of voice | Only with category and audience context | No | Yes |
| Retention overlap | No for new pipeline | Directly relevant | Sometimes |
The highest-value cut is buyer relevance, not demographic reach. Compare awareness among target accounts, active evaluators, customers, and people outside the buying market. If gains concentrate among people who will never enter your category, the campaign improved a marketing metric without improving commercial access. Reallocate spend toward the audiences and perception shifts tied to pipeline, retention, or pricing power.
What Trustworthy Brand Health Measurement Requires
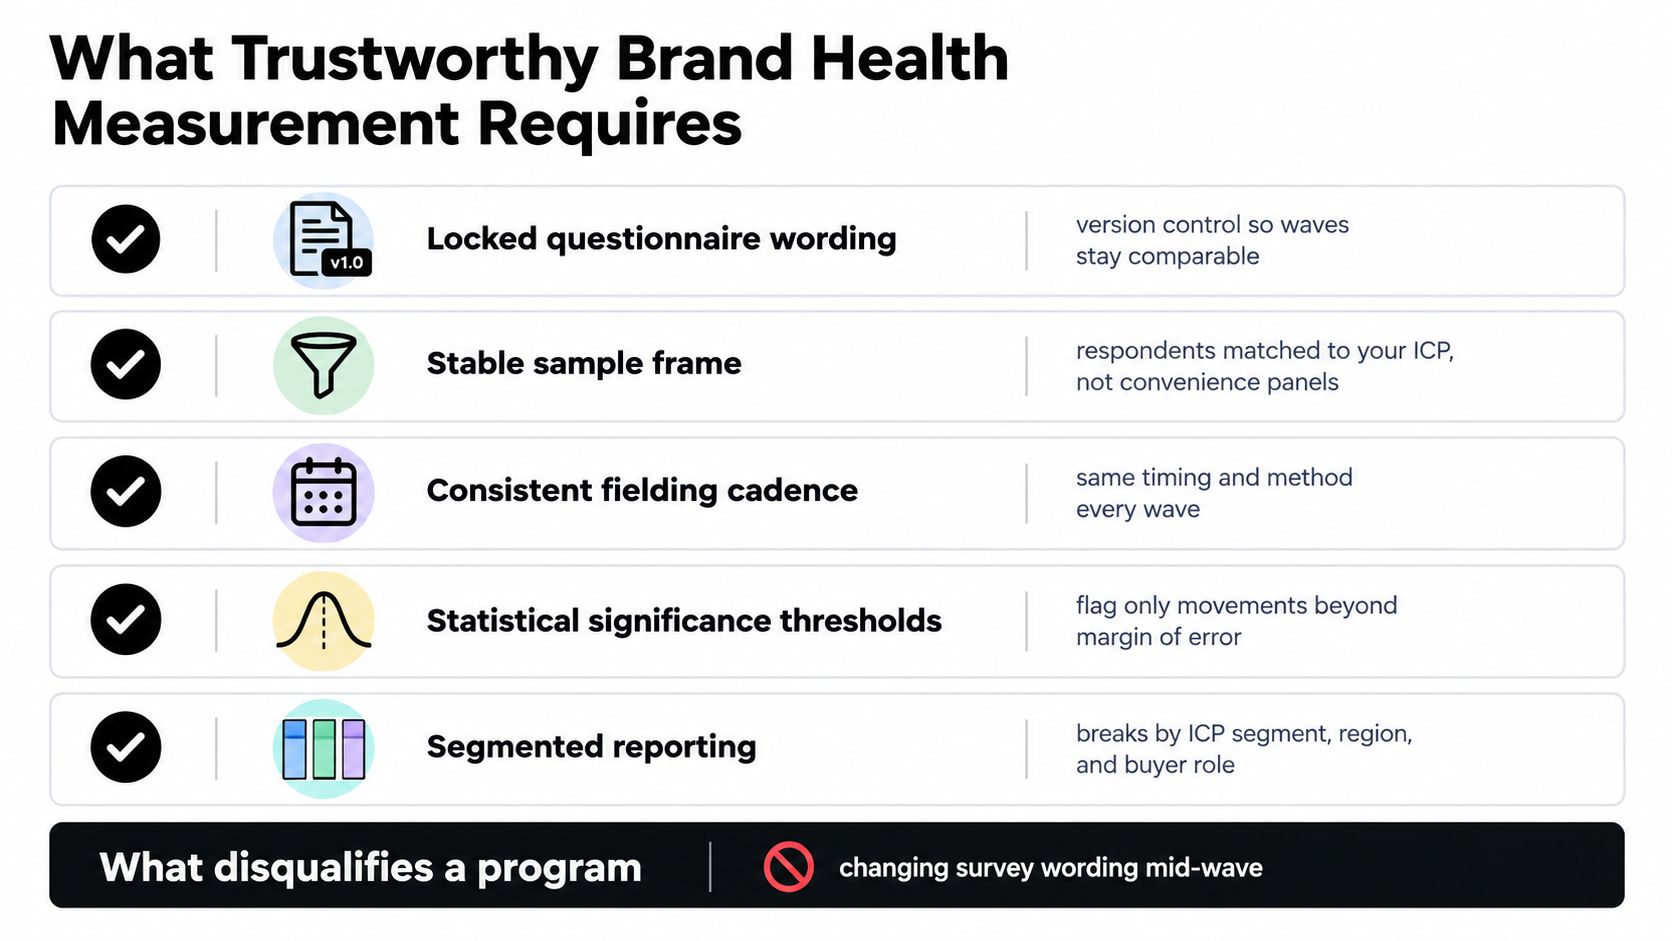
A trustworthy measurement program begins with a controlled system. Lock the questionnaire, sample design, audience definitions, and scoring rules before comparing waves. Track on a consistent quarterly or wave-based cadence, then interpret trend changes rather than isolated point estimates. That discipline separates a commercial signal from boardroom theater.
Lock the measurement system
Question wording, answer options, audience definitions, and scoring rules require version control. If the questionnaire changes midway through a wave, the reported movement may reflect the instrument instead of the market.
The sample must represent the ICP. A convenience audience can produce polished results that reveal little about the people who buy, renew, or influence deals. Stable sample frames support trend analysis. Segment cells show whether an aggregate change matters to the business.
Run surveys on a consistent cadence. Quarterly tracking works as a practical default for strategic movement, while behavioral monitoring can run continuously outside the survey. Use survey responses to measure perception, then test those findings against search, direct traffic, branded demand, pipeline, renewal, and expansion data. Exposed and control audiences can help isolate campaign impact, while broader guidance on awareness measurement supports combining survey measures with behavioral proxies, as described in this overview of brand awareness measurement.
Read movement, not decoration
A point estimate is a snapshot. A trend delta shows direction only when the method remains stable. A three-point share-of-voice change across comparable waves can guide a decision more effectively than a single 31% result with a wide interval. The question is whether the movement changes an investment, message, audience, or forecast.
Every board output should disclose four items:
- Sample source: Who was invited, and how were respondents recruited?
- Fieldwork dates: When did collection occur relative to campaigns, launches, or incidents?
- Response counts by cell: Can the audience and regional cuts support interpretation?
- Weighting: What adjustments were applied, and why?
Without those details, executives cannot distinguish market movement from a sample shift. Teams assessing the reliability of business data can use the same standard: document how data was collected, processed, checked, and interpreted.
Audit rule: If the methodology cannot fit in a plain-language footnote, the headline number is not ready for a board deck.
The standard is traceability. A director should be able to ask where a number came from, which audience it represents, what changed since the prior wave, and which commercial decision follows. If no decision follows, remove the metric from the executive narrative.
Connecting Brand Perception to Revenue and Trust
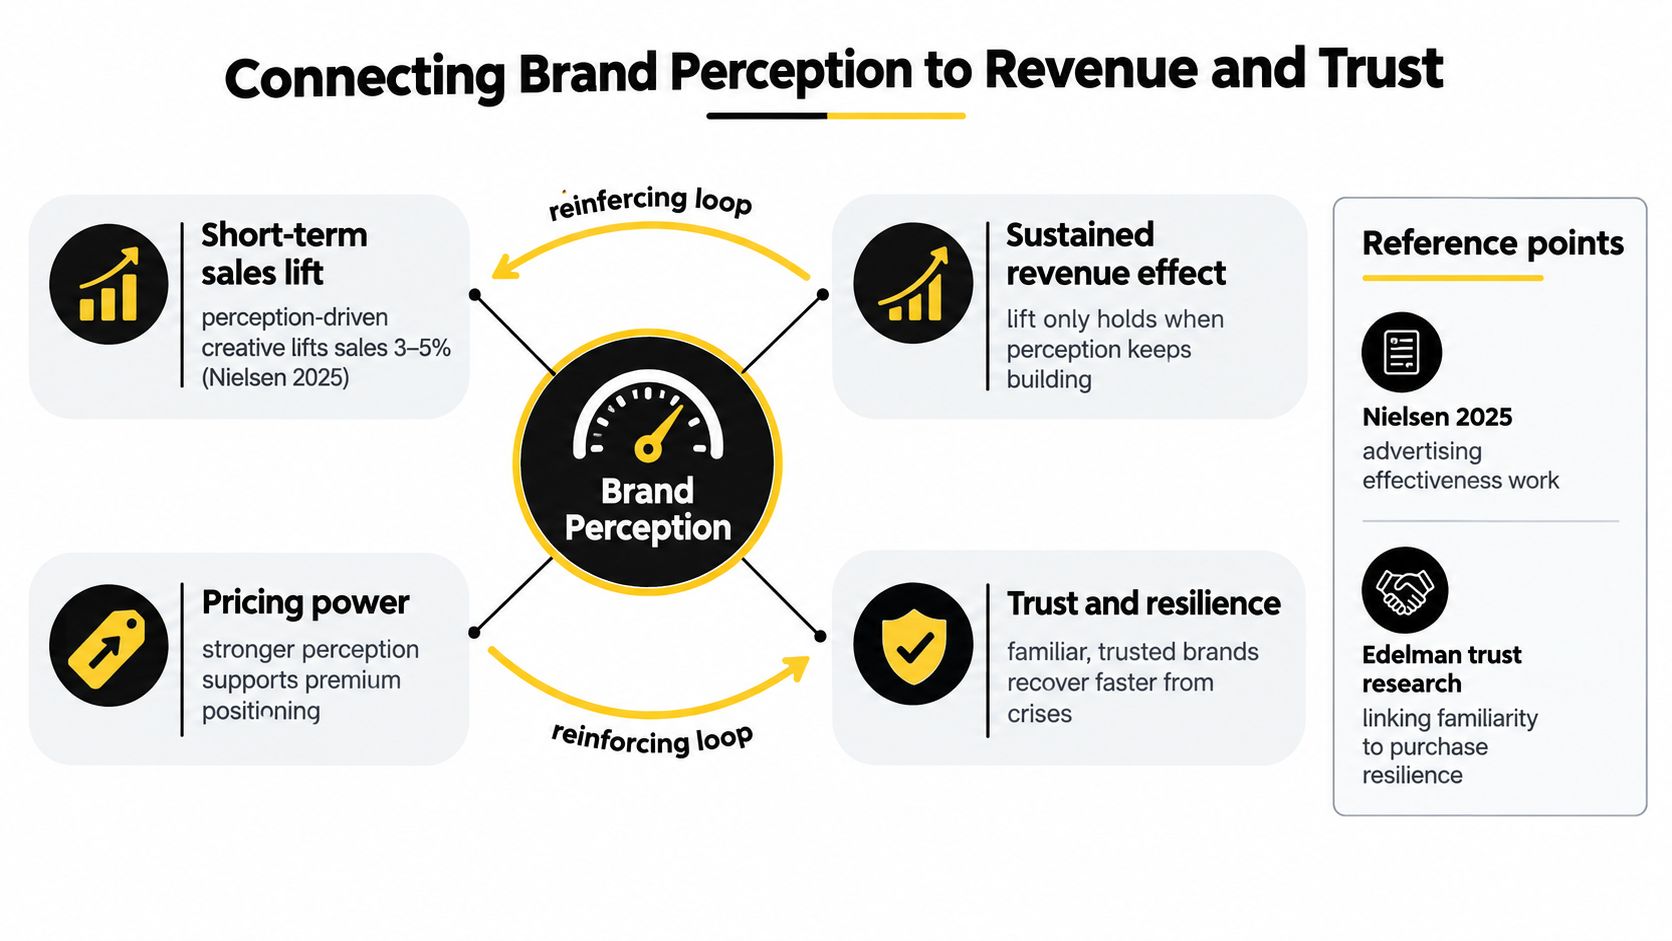
Brand perception creates commercial value only when it connects to the people and moments that shape revenue. Aggregate scores hide that relationship. Segment results by market, buyer role, company profile, product, lifecycle stage, and customer cohort before deciding what to change.
The Nielsen advertising effectiveness reference point frames the relationship clearly. Perception-driven creative can lift short-term sales by 3% to 5%, but that effect lasts only when brand metrics move in parallel, as summarized in Nielsen's advertising effectiveness research. The implication is direct: a sales spike without continued improvement in memory, preference, trust, or differentiation is a campaign result, not proof of durable brand equity.
Trust is a market-specific variable
Trust should not be reported as one universal company score. Edelman's 2025 Brand Trust report found that domestically headquartered brands outpaced foreign brands by an average of 15 points across global markets, with gaps of 30 points in Germany and 29 points in Canada, according to the Edelman Brand Trust report.
Those differences change the commercial meaning of the same message. A positioning that raises confidence in one market may fail in another because buyers apply different standards to origin, expertise, risk, and institutional familiarity. Keep those differences visible in the tracker. Averaging them away removes the signal sales and product leaders need.
Use this commercial chain to connect perception with operating outcomes:
- Perception: Buyers associate the brand with a relevant, credible benefit.
- Consideration: The brand enters the shortlist.
- Conversion: Trust and differentiation reduce perceived purchase risk.
- Retention: The delivered experience confirms the promise.
- Pricing and expansion: Confidence supports premium positioning and broader adoption.
The chain requires evidence. Connect survey responses to CRM outcomes at the cohort level, then test relationships between perception, win rate, renewal, expansion, and discounting. Treat each relationship as a management hypothesis until it holds across repeated waves and alternative explanations.
Brand health becomes a revenue system only after segmentation and reconciliation. A global score can describe the organization. It cannot tell a regional sales leader which perception to fix, which commercial outcome to watch, or whether the proposed investment deserves board approval.
Surfacing Audit-Ready Brand Metrics for Boards
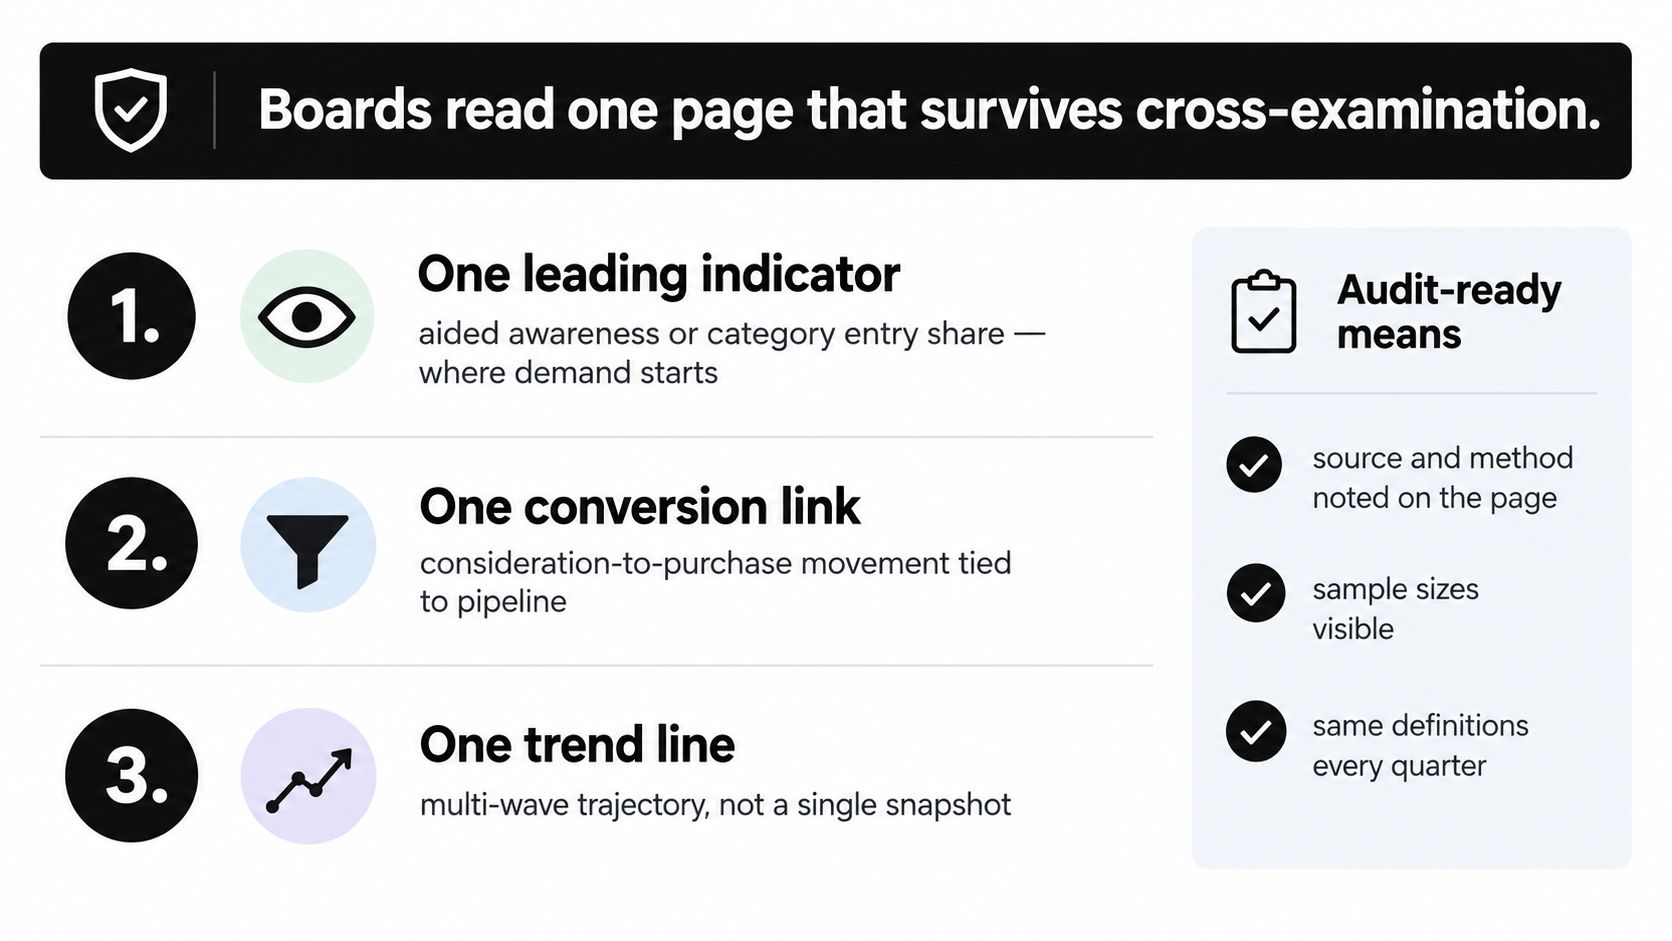
Boards don't read forty-page trackers. They read one page that survives questions from finance, sales, and operations.
Build that page around three signals. Use one leading indicator, one commercial conversion link, and one trust or visibility signal. The exact choices depend on the growth stage, but the structure should remain stable.
The one-page board view
Leading indicator: Use aided awareness or category entry share to show whether future demand is forming. Display the movement across comparable waves and identify the audience responsible for the change.
Commercial link: Use consideration-to-purchase movement tied to pipeline, or retention overlap tied to renewal and expansion. This is the line that prevents the brand report from floating free of operating reality.
Trust signal: Use segment-level sentiment, relevant advocacy, or share of voice against the category. Explain what the signal means in the markets and buyer groups that matter.
The page should show at least four quarters of movement, segmented by market and ICP. It should reconcile with CRM-sourced pipeline, retention, and expansion data. Point estimates can sit in supporting material, but the board page should emphasize quarter-over-quarter direction and the decision attached to it.
A plain-language methodology note is mandatory. State the sample source, fieldwork timing, response counts, weighting, and definitions. The reader shouldn't need the full methodology deck to understand whether the change is trustworthy.
Then add the decisions. For example:
- Messaging: Fund a differentiation test because consideration is weakening among active evaluators.
- Market allocation: Rebalance investment because trust is materially different across regions.
- Customer experience: Escalate an onboarding issue because detractor themes overlap with renewal risk.
- Reporting: Remove a broad awareness metric because it has no observed connection to pipeline or retention.
The dashboard is not the product. The decision record is. Teams that need a practical model for making executive reporting clearer can review these reporting best practices.
HelpWithMetrics offers a managed semantic layer, an AI data analyst inside your infrastructure, and customized Looker Studio dashboards that can reconcile brand health measures with CRM and operating data. Visit HelpWithMetrics to book a call and get a free first dashboard built around the metrics your board needs.