Data latency is the gap between when an event happens in the business and when a leader sees it in a report, and it can be measured in milliseconds, seconds, or even nanoseconds. That gap is usually a chain of three delays, ingestion, processing, and access, not one clean number.
You know the symptoms. The revenue dashboard says one thing, Stripe says another, and the spreadsheet someone downloaded yesterday has a third answer. People start debating whose number is “right” before anyone asks when each system last received, transformed, or displayed the underlying event.
That is the operational meaning of data latency. It isn't merely a technical performance metric. It determines whether a decision reflects what is happening now, what happened earlier, or what your systems happened to make available last.
Table of Contents
- The Morning Your Numbers Stop Matching
- Defining Data Latency as a Chain of Delays
- The Three Types of Latency That Actually Matter
- Batch Versus Streaming and the Latency Tradeoff
- What Latency Costs a SaaS or E-commerce Business
- How Semantic Layers and CDC Fix the Trust Problem
- Your 30-Day Latency Audit Checklist
- Why Latency Is a Hiring Decision in Disguise
The Morning Your Numbers Stop Matching
At 9:00 a.m. on Monday, the SaaS leadership meeting begins with three incompatible answers. The revenue dashboard shows $182K MRR, the churn dashboard shows 3.1%, and Stripe says something else. Those figures are part of the scenario, not verified business data, but the conflict is familiar to almost every growing company.
The CRO accuses sales of sandbagging. The head of customer success blames a billing issue. Finance has already exported a CSV, and that file contradicts both dashboards. Nobody can discuss the forecast, retention plan, or hiring priorities because the first task is reconciling the tools.
Forty-five minutes disappear. The team compares refresh timestamps, checks filters, inspects account lists, and discovers that each dashboard is built on a different schedule, source, or transformation rule. The argument looks like a metrics-definition problem, but the deeper failure is latency across the reporting chain.
The number wasn't wrong in the same way
One dashboard may have ingested subscription changes quickly but still be waiting for a transformation job. Another may use a warehouse table refreshed overnight. A third may query a billing platform directly, with different cancellation and credit logic.
That means every team can be acting rationally while using stale or incompatible evidence. The CRO isn't necessarily hiding a pipeline problem. Customer success isn't necessarily misreading churn. Finance isn't automatically the authority because its CSV looks more recent.
Operator's rule: A metric without a freshness timestamp is an opinion wearing a decimal point.
For a company with roughly 50 to 200 people, this is one of the most expensive recurring meetings because it consumes senior attention before producing a decision. The cost isn't limited to the meeting. Leaders delay action, teams build private spreadsheets, and every new analyst or operator inherits a reporting system nobody fully trusts.
The fix starts by treating latency as a chain rather than blaming the dashboard. Once you separate source ingestion, data processing, and report access, the disagreement becomes diagnosable. You can identify which system is late, which transformation changes the meaning, and which report is presenting old information as current.
Defining Data Latency as a Chain of Delays
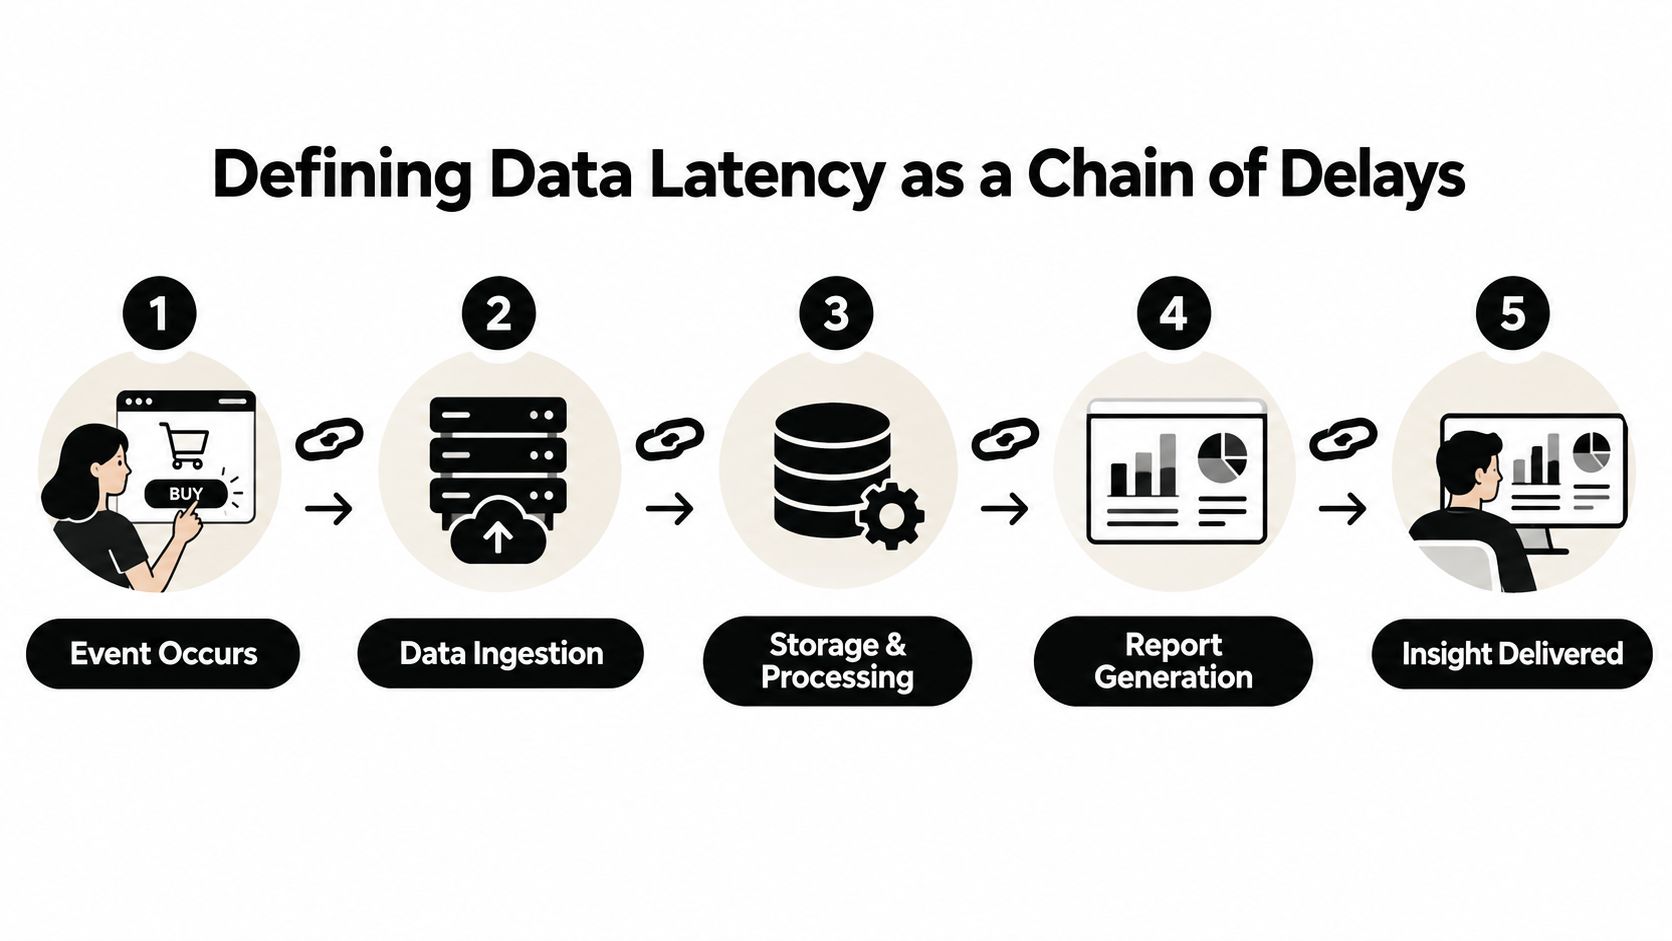
The textbook definition is straightforward: data latency is the time between an event occurring in the business and that event appearing in a report used for a decision. If a customer upgrades today but the revenue report reflects the change later, the gap is data latency.
The problem is that businesses rarely experience that gap as one measurable interval. They experience a sequence:
- Ingestion latency is the time between an event in a source system and its arrival in the data platform.
- Processing latency is the time required to clean, join, transform, and model that data.
- Query latency is the time between a user requesting a result and the front end displaying it.
IBM distinguishes data latency from network latency, while also describing related measures such as round-trip time and time to first byte. Its explanation of data latency and how it is measured is useful because it connects the technical delay to a practical business consequence: a dashboard that refreshes in minutes gives a decision-maker older information than one that refreshes in seconds.
Why the chain matters
Leaders often blame the visible layer. A dashboard takes too long to load, so someone replaces the BI tool. But a faster interface can't display an event that hasn't reached the warehouse. Conversely, a near-current warehouse won't create trustworthy reporting if a transformation drops refunds or applies a different definition of active customer.
An ETL pipeline is one common place where those delays accumulate. A clear overview of what an ETL pipeline does helps separate movement from modeling, although the business question remains broader than the pipeline itself.
Oracle describes the operational distinction clearly. Batch systems may tolerate minutes to hours, while streaming systems target seconds to milliseconds when stale pricing, inventory, or revenue information creates real consequences. Its guide to data latency in business systems reinforces the point that latency is caused by multiple factors, including network conditions, processing bottlenecks, and storage or access overhead.
Use this working definition throughout your company: data latency is the total delay from business event to usable decision, measured across ingestion, processing, and access.
The Three Types of Latency That Actually Matter
The three delays deserve different business tolerances. Treating them as interchangeable creates bad investment decisions, because the cure for a slow report isn't the same as the cure for missing source events.
| Latency Type | Typical Tolerance | Decision That Breaks | Symptom Leaders Notice |
|---|---|---|---|
| Ingestion latency | Minutes to hours | Fraud, inventory, or live operations decisions | The source system changed, but the warehouse hasn't |
| Processing latency | Hours to overnight | Daily cohorts, KPI reviews, and operating plans | The data arrived, but the modeled number is stale |
| Query latency | Seconds to minutes | Dashboard review and ad hoc decisions | Reports time out, so teams export to spreadsheets |
Ingestion latency
Ingestion is the first delay after the event occurs. A payment may be captured, a product may sell out, or a customer may cancel, but the reporting layer can't use that change until the source record arrives.
This delay matters most when the business must respond while conditions are changing. A late inventory event can leave merchandising teams selling stock that no longer exists. A late fraud signal can allow a suspicious pattern to continue. A late operations event can make an incident dashboard look calm after the underlying system has already deteriorated.
The visible symptom is simple: people compare the source application with the warehouse and discover that the warehouse is behind.
Processing latency
Processing begins once the raw event lands. Transformations standardize fields, join entities, apply business rules, and produce the tables leaders query.
Numbers can become stale without looking broken. The pipeline may succeed, the warehouse may contain recent rows, and the dashboard may load normally. Yet the churn model still reflects the previous processing cycle because the relevant transformation hasn't completed.
A daily standup can run on yesterday's customer cohort while everyone assumes the report is current. Dremio's discussion of data latency across modern data platforms is especially relevant here because it frames latency as the time until information becomes usable for analytics or downstream decisions, not merely the time until a raw record exists.
Query latency
Query latency is the final delay. The data is available, but the BI tool takes too long to retrieve, calculate, or render it.
This is the layer leaders notice first because it interrupts the meeting. Dashboards spin, filters fail, and users download data into Excel. That workaround may feel productive, but it fractures the single source of truth and introduces private logic that nobody else can audit.
The chain creates two dangerous failure modes. Slow ingestion forces fast queries to present old information quickly. Fast ingestion combined with broken transformations produces fresh-looking, confidently wrong numbers. Improving one link without checking the others often increases trust in a report that still doesn't deserve it.
Batch Versus Streaming and the Latency Tradeoff
Batch and streaming aren't competing religions. They're choices about how quickly a decision must respond to a business event.
Batch processing groups changes and makes them available on a schedule. It suits board reporting, monthly forecasting, weekly pipeline review, and other decisions where the business can act on an accumulated view. Streaming moves events continuously and earns its complexity when a person or automated system must respond within minutes, such as fraud detection, dynamic pricing, or live customer support routing.
Oracle's distinction between batch tolerance and streaming targets supports this business framing. For a practical explanation of real-time data for live metrics, Fundl offers useful context on why continuously updated information matters when teams need an immediate operational view.
| Dimension | Batch | Streaming |
|---|---|---|
| Freshness | Scheduled updates | Continuous or near-continuous updates |
| Cost | Lower operational complexity for suitable decisions | Higher complexity when continuous movement is required |
| Burden | Easier to monitor and reconcile | More components and failure modes to manage |
| Best fit | Forecasting, board packs, periodic reviews | Fraud, pricing, inventory, live operations |
| Main risk | Decisions use information that is older than intended | The company pays for freshness nobody acts on |
Match architecture to the decision
Most companies don't need every metric updated continuously. A finance leader reviewing a monthly forecast doesn't gain meaningful value from a stream of every event if the decision itself is made periodically. A support team assigning live conversations may need a much fresher queue because delay changes who gets helped next.
The mistake is paying for the vendor demo instead of the decision. Streaming architecture can look impressive, but infrastructure doesn't create urgency where the operating model has none. It can also make reconciliation harder if the organization lacks clear definitions and ownership.
Practical rule: Pay for the latency your worst decision requires, not the latency your platform promises.
The right design may be mixed. Keep financial reporting on a dependable batch cycle, while giving fraud or inventory workflows a faster path. The point isn't to make every table live. It's to prevent an important decision from depending on data that arrives too late.
For the conceptual distinction between continuous event flows and scheduled movement, see this guide to what streaming data means. The architecture should follow the consequence of being late, not the fashion of the data stack.
What Latency Costs a SaaS or E-commerce Business
Latency becomes expensive when it changes a decision before anyone realizes the information was old. The loss usually appears under another label, churn, margin erosion, chargebacks, forecast error, or executive distrust.
Consider a SaaS company whose churn dashboard is 18 hours late. That figure comes from the scenario in the brief, not a verified external case study. Customer success works yesterday's save list, reaches accounts that have already cancelled, and misses accounts that became genuinely at risk after the previous refresh. The team may call the problem a retention issue, but the first failure happened in reporting freshness.
The same scenario says the CEO spent two weeks making pipeline decisions from numbers two days stale, with an estimated loss of roughly 8% of net new ARR. Those are scenario assumptions, not verified market statistics. They still illustrate the mechanism clearly: stale churn and pipeline information can redirect a leadership team long before a quarterly review exposes the error.

E-commerce exposes the timing problem
The second scenario involves a mid-market e-commerce brand running a promotion while its inventory feed is two hours behind. The store sells units that are no longer available, then deals with a 4.2% chargeback rate and a six-figure Stripe reserve. Again, these are supplied scenario details, not verified facts about a named company.
The operational chain is easy to follow. A purchase changes available inventory, the source event arrives late, the storefront keeps presenting stock as available, and the business absorbs refunds, support work, payment risk, and customer dissatisfaction. The dashboard didn't merely report the problem late. It allowed the commercial system to continue making decisions from an old state.
Neither example proves that every company needs real-time analytics. It proves something more useful: latency must be judged against the decision it can invalidate. A daily executive report may be appropriate for one metric and dangerous for another. The correct target is not maximum freshness. It's sufficient freshness for the consequence at hand.
How Semantic Layers and CDC Fix the Trust Problem
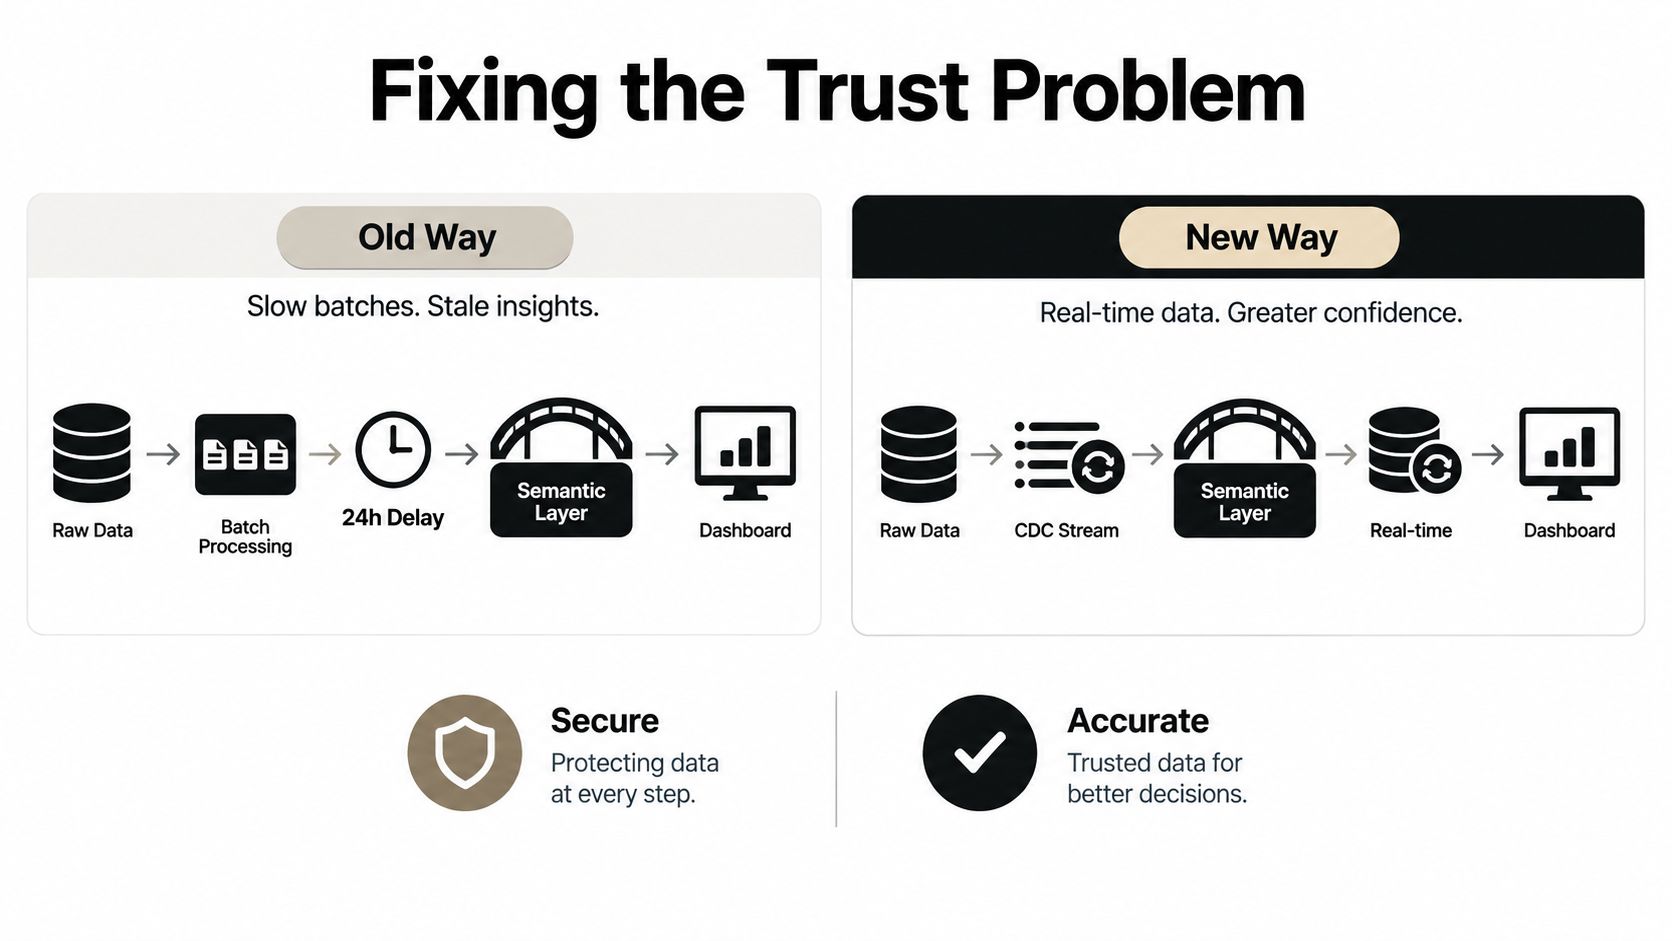
Trust breaks for two separate reasons: information arrives late, and different tools define the same metric differently. Change Data Capture, or CDC, addresses the first problem. A semantic layer addresses the second.
CDC captures row-level changes as they occur in a source system and moves them through the data platform without relying on a slow polling cycle. In the scenario provided, that can replace a default 4 to 24 hour stale window with a much shorter path. The number is context-specific and should not be treated as a universal performance guarantee. Oracle's broader explanation of latency supports the underlying principle: reducing the time between source change and usable data improves decisions when freshness has operational consequences.
The semantic layer sits above the raw and modeled data. It defines terms such as revenue, churn, active user, and customer in one governed vocabulary, then makes those definitions available to dashboards, ad hoc queries, and AI interfaces.
Faster movement doesn't repair inconsistent meaning
CDC can deliver the latest transaction while leaving three incompatible revenue definitions untouched. One dashboard may count booked revenue, another collected cash, and a third net revenue after credits. All three can be current and still disagree.
That is why the two capabilities work in tandem rather than as isolated features. CDC reduces the ingestion delay. The semantic layer reduces interpretation drift. Together, they can remove major points of failure without requiring a complete warehouse rebuild.
Leaders shouldn't ask whether a vendor has CDC or a semantic layer as a feature checklist. They should ask whether the business can answer one metric consistently across executive reporting, operating reviews, and AI-assisted questions. A useful introduction to semantic layer architecture explains why the definition layer matters as much as the movement layer.
The outcome is straightforward. Source changes become available sooner, business definitions remain aligned, and a new employee doesn't need to reverse-engineer five dashboards to learn what “active customer” means.
Your 30-Day Latency Audit Checklist
A latency audit should locate the broken link before anyone buys another tool. Run it as a business review, not as an infrastructure vanity project.
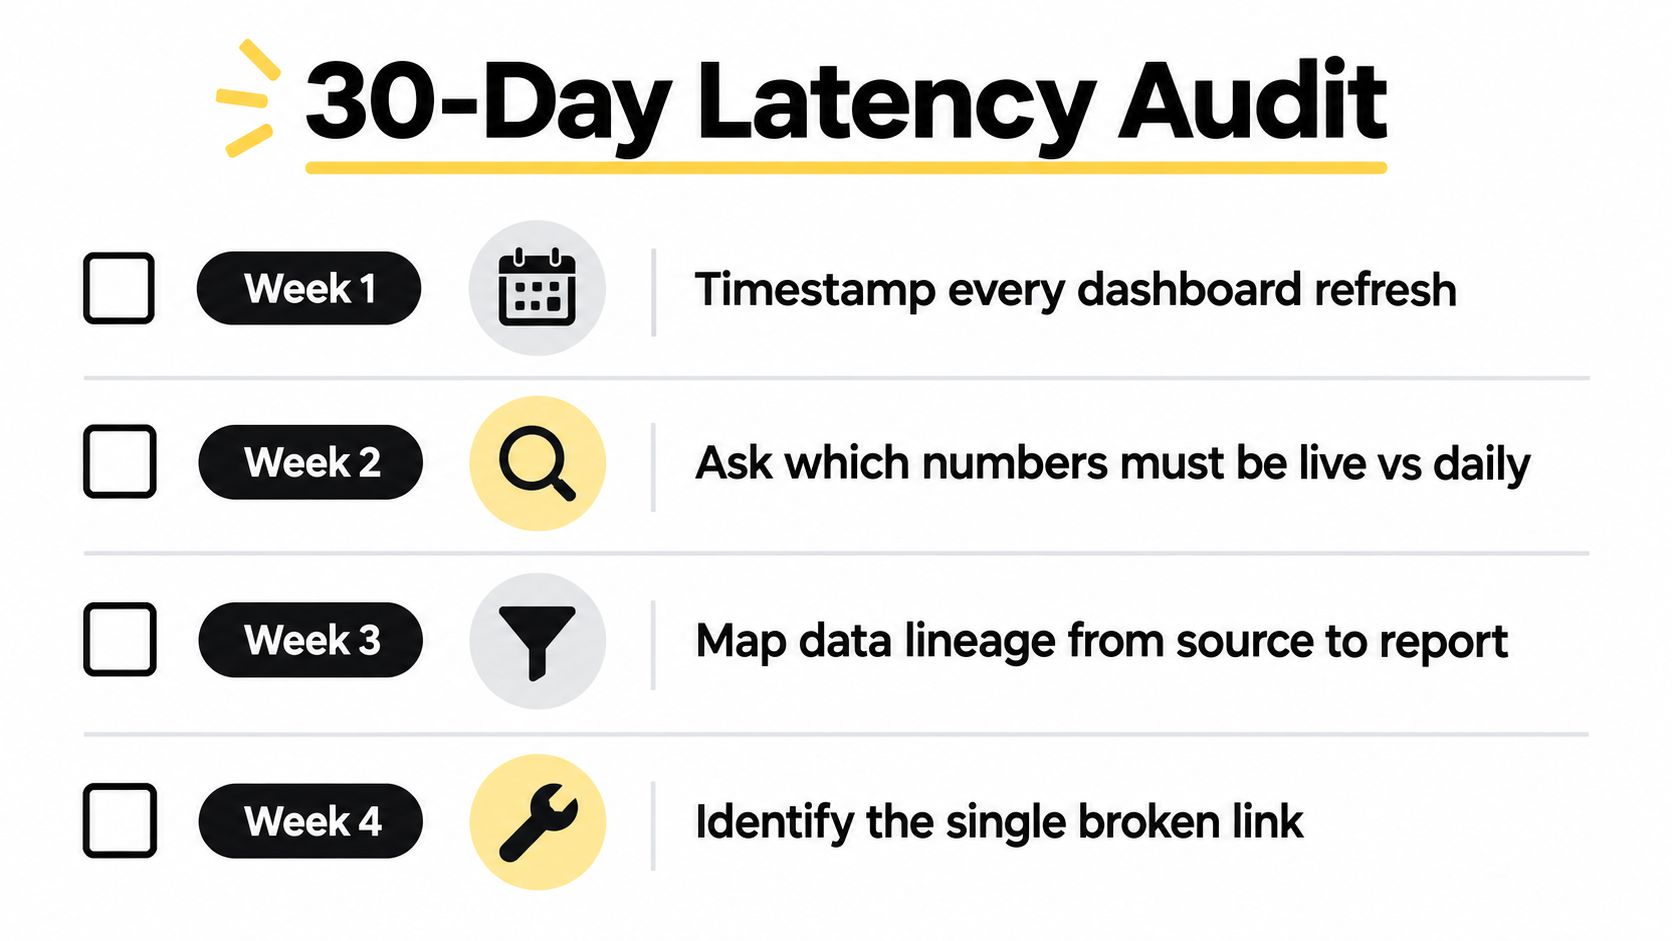
Week one, establish the freshness contract
Timestamp every dashboard refresh and record the source behind each important metric. Then classify decisions by required freshness:
- Live decisions: Fraud, inventory, incident response, and other workflows where delay can change the outcome.
- Daily decisions: Operating reviews, customer cohorts, and performance management.
- Periodic decisions: Board reporting, forecasting, and planning cycles.
Don't call a report “real time” because it refreshes often. Write down when the underlying source changes, when the warehouse receives that change, and when the report becomes usable.
Week two, inspect the arrival path
Trace each priority metric from its source application into the warehouse. Look for overnight batches presented as current data, polling intervals that lag behind the business, and source systems that update later than users assume.
The goal isn't to redesign the pipeline during the audit. It's to identify whether the event is missing, late, duplicated, or present only in raw form. A raw row arriving quickly doesn't prove that the metric is ready for decisions.
Week three, challenge the access layer
Measure how long the report takes to answer a normal question. Check whether joins, filters, caching, or complex calculations create the final delay. Then compare the metric definition in the dashboard with the source and any shared semantic model.
If users export to spreadsheets because the dashboard is slow, treat that behavior as evidence. It shows that the access layer has failed, even if the underlying warehouse is healthy.
Week four, run one controlled event
Create a known business transaction at a recorded time and follow it through every report. By 9:15 a.m., check whether each system shows the same event, with the same status and metric treatment. The 9:00 a.m. and 9:15 a.m. times belong to this audit example, not a general performance benchmark.
Audit standard: Fix the bottleneck you can demonstrate. Don't add a faster dashboard to compensate for a late source or a broken transformation.
At the end of the audit, assign one owner to the broken link and one owner to the metric definition. If nobody owns either, the company will keep treating contradictory reports as a people problem.
Why Latency Is a Hiring Decision in Disguise
For a company without a data team, sub-second freshness is often a hiring problem dressed up as a tooling problem. CDC pipelines, semantic definitions, monitoring, incident response, and stakeholder alignment all need ownership. A platform can automate parts of that work, but it can't decide who investigates when a dashboard breaks at 2:00 a.m.
That distinction matters more than the product demo. A senior data engineer may build an excellent stack, but the company still needs to recruit, manage, retain, and support the person responsible for it. A done-for-you analytics partner can provide the operating capability sooner, especially when the business needs trustworthy metrics but doesn't yet have enough sustained data complexity to justify a dedicated team.
No verified salary or revenue threshold is provided here, so the decision shouldn't be reduced to an invented annual cost or a universal ARR rule. Use the actual workload instead. If the company needs constant custom modeling, deep platform ownership, and rapid internal iteration, an in-house hire may be justified. If the immediate requirement is consistent reporting, governed metrics, and reliable answers without building a department, an external partner is often the faster route.
| Factor | In-House Senior Data Engineer | Done-For-You Analytics Partner |
|---|---|---|
| Time to capability | Depends on recruiting and onboarding | Begins with an existing delivery team |
| Ownership | Dedicated internal responsibility | Shared service responsibility with defined scope |
| Flexibility | Strong for changing internal priorities | Strong when the service has a clear operating model |
| Management burden | Recruiting, retention, roadmap, and coverage remain internal | Vendor coordination replaces most people-management work |
| Best fit | Sustained platform complexity and internal data demand | Trustworthy metrics needed before a data team exists |
The question is not “Which tool should we buy?” It's “Who owns the full latency chain and the meaning of the numbers?” Until that answer is clear, faster ingestion can produce faster confusion and a new BI license can produce a more polished version of the same stale report.
HelpWithMetrics gives companies with 20 to 200 employees a done-for-you analytics function, including governed metrics, reliable dashboards, and AI-answerable data without requiring a first data hire. Visit HelpWithMetrics to book a call and get a free first dashboard built around the decisions your team needs to trust.