Most advice about what is streaming data starts with speed. Faster dashboards, lower latency, instant alerts. That framing is incomplete and often expensive. A dashboard that refreshes every few seconds doesn't help an executive decide anything if the CRM, billing system, and product analytics still disagree about what revenue or churn means.
Streaming is valuable when it makes a decision more trustworthy and more actionable, not merely because an event arrives sooner. Fresh contradictions are still contradictions. In some companies, they create more arguments because every system updates on a different schedule and applies a different definition.
The practical question is simple: does a live data flow change what someone does today? If it doesn't, a reliable batch pipeline is usually the better investment. If it does, streaming can turn an operational signal into an intervention while there's still time to act.
That distinction matters across domains. A useful explanation of real-time esports data explained shows why live events matter when conditions change during the action itself. Most SaaS reporting doesn't face that kind of decision pressure. Before adopting streaming, assess the broader problem of data reliability, including completeness, consistency, and whether your teams trust the number on the screen.
Table of Contents
- Why Faster Data Is Usually the Wrong Problem to Solve
- What Streaming Data Actually Means
- How a Streaming Pipeline Moves an Event
- Streaming vs Batch and When Each One Wins
- Where Streaming Data Pays Off in SaaS and E-Commerce
- Streaming Data and the Rise of AI-Answerable Metrics
- Trade-Offs and Best Practices Before You Build
- FAQ on Streaming Data for Operators
Why Faster Data Is Usually the Wrong Problem to Solve
Dashboards refreshing every five seconds rarely change a board meeting, a pricing review, or a quarterly hiring decision. Yet teams routinely approve streaming projects because latency sounds like the visible failure. The actual failure is usually that the same customer appears differently in the CRM, billing platform, and product analytics.
That conflict produces operational waste. RevOps reports one expansion number, finance reports another, and product uses a third definition of an active account. People spend the meeting reconciling spreadsheets instead of deciding whether to change pricing, call a customer, or adjust the forecast.
Practical rule: Treat freshness as a quality requirement only when a delayed signal changes an action.
Streaming can make a weak metric system noisier. If one pipeline counts refunds at the payment event, another counts them when the accounting record settles, and a third excludes them from customer revenue, live processing doesn't resolve the disagreement. It exposes each interpretation sooner.
Trust comes before latency
A trustworthy metric needs a defined owner, a stable meaning, a known source, and a way to explain exceptions. Streaming adds a continuous event flow, but it doesn't automatically provide those controls. Without them, operators get faster access to numbers they still can't defend.
The right sequence is therefore straightforward:
- Define the decision: Identify the action that depends on current information.
- Define the metric: Agree on inclusions, exclusions, timestamps, and ownership.
- Test the delay: Establish whether batch delivery arrives too late to matter.
- Choose the architecture: Add streaming only when the business case survives those tests.
This approach is less fashionable than buying a real-time stack. It's also more likely to produce reporting people use.
What Streaming Data Actually Means
Streaming data is a continuous flow of events processed as they arrive, rather than a collection accumulated for a scheduled job. Think of a store register. A batch process counts the day's transactions later, like a manual inventory review. A streaming process handles each sale as the scanner records it.
The distinction isn't that one system stores data and the other doesn't. Both may retain events. The distinction is when processing happens and when the resulting information becomes available for a decision.
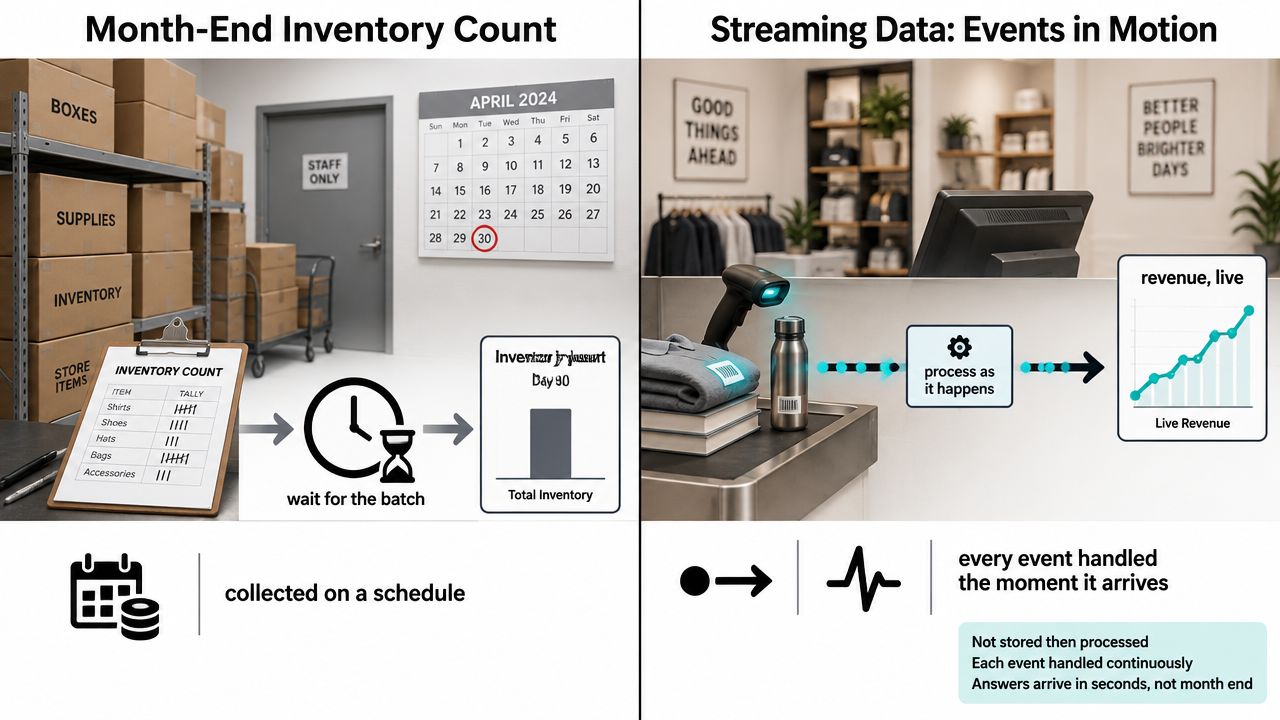
Consider a SaaS purchase. In an event-driven design, the signup or payment event enters the pipeline when the customer clicks purchase. The system can validate it, update a current-state view, and trigger a downstream action without waiting for a nightly warehouse job. In a batch design, that same event may sit in an operational database until a scheduled extraction loads it for later transformation.
The phrase “real time” also hides several different operating models:
- Sub-second processing: Used for immediate controls, such as transaction risk decisions or machine responses.
- Near-real-time reporting: Dashboards update frequently enough for operational intervention, often on a short recurring interval.
- Daily batch processing: Reports and models refresh on a schedule because the decision doesn't depend on current events.
Most companies calling their dashboards real time are pursuing the middle category. That may be completely adequate. The business needs a useful freshness target, not the lowest possible latency.
Streaming is a system, not a product
The history helps clarify the concept. Researchers formally described streaming data in 2002 as continuous, rapid, time-varying streams rather than persistent relations, and Google's Millwheel work in 2008 helped move fault-tolerant streaming toward internet-scale infrastructure. Apache Kafka was open sourced in 2011, making a LinkedIn-built event backbone broadly available for high-throughput, low-latency pipelines, as documented in this history of streaming real-time data.
Tools such as Kafka, Amazon Kinesis, and Google Pub/Sub handle transport and event delivery. They aren't the business metric layer. The analytics layer still needs to define revenue, retention, usage, and customer state in a way that humans and downstream systems can interpret. A useful conceptual contrast is what an ETL pipeline does, because streaming changes the timing of movement and transformation, not the need for sound data modeling.
How a Streaming Pipeline Moves an Event
Take one checkout event from Shopify and follow it to a revenue dashboard. The business sees a payment. The pipeline sees a sequence of decisions about identity, delivery, transformation, storage, and presentation.
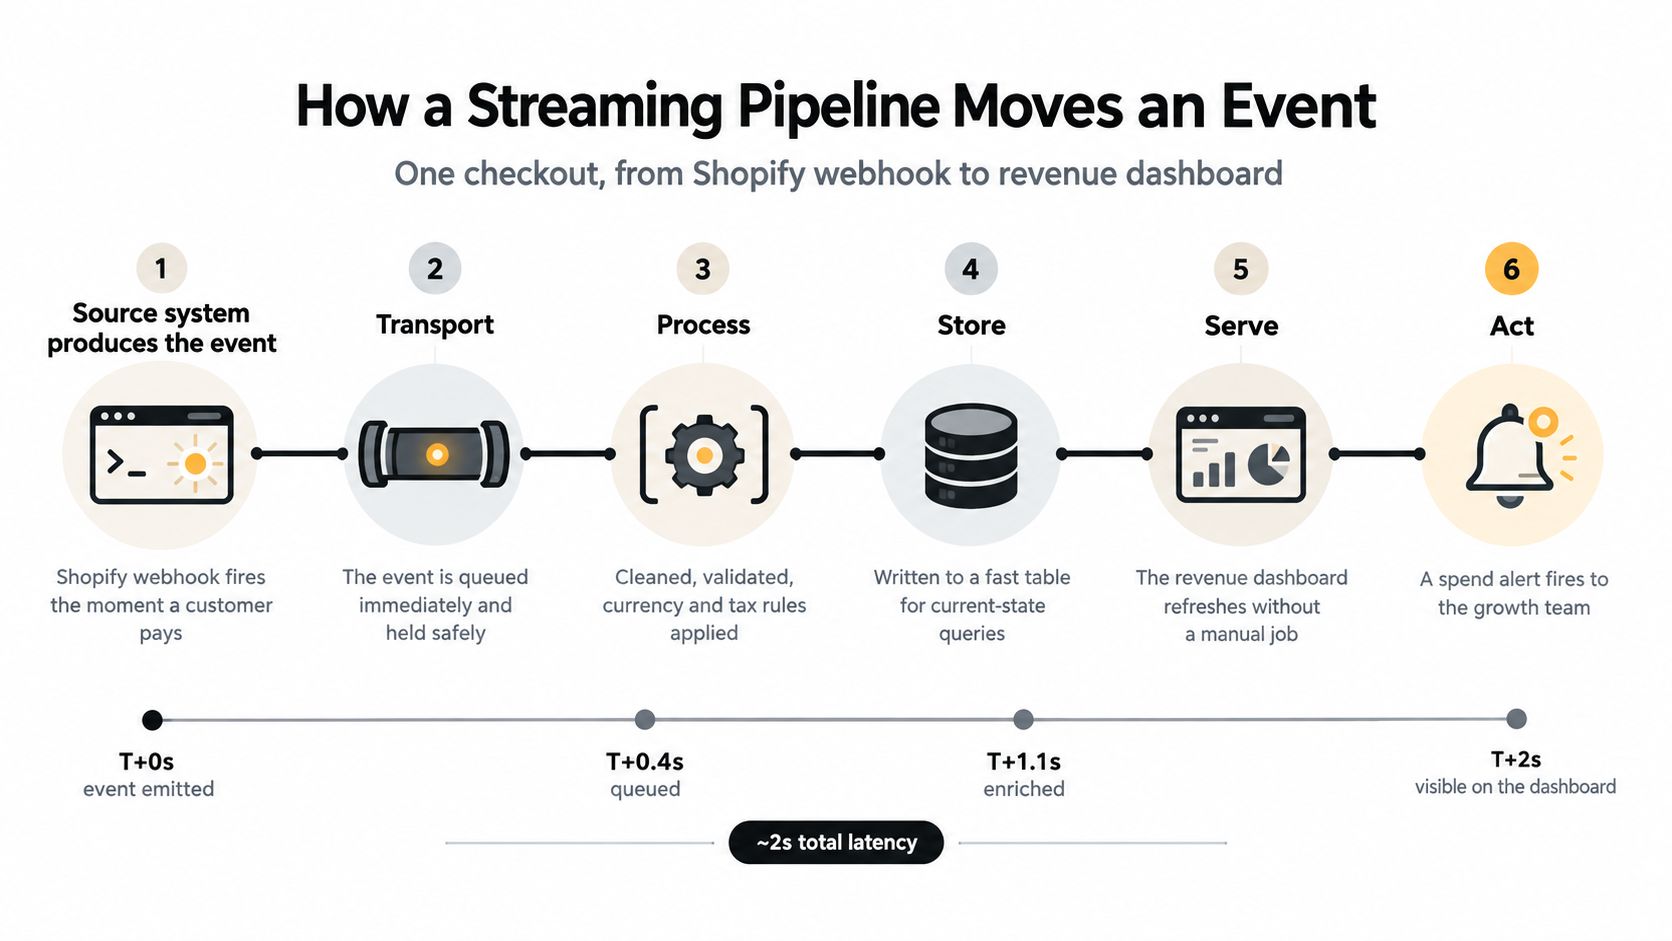
The event enters the system
The source system emits an event containing useful business context, such as a customer identifier, order value, currency, and timestamp. A webhook or application event is only as reliable as its payload. If the source omits an account identifier or changes the meaning of a field without warning, every downstream consumer inherits the problem.
The ingestion layer receives the event and places it in a durable transport mechanism. That buffer separates the checkout system from the dashboard and gives downstream services an opportunity to recover if a consumer slows down or becomes temporarily unavailable. It also creates a place to observe lag, duplicates, and delivery failures.
Processing turns an event into a metric
A transformation layer validates the payload, standardizes fields, applies currency and tax rules, and joins the order to subscription or account data. The output might be net revenue, a paid conversion event, or an updated customer state. These calculations belong in a governed metric model, not in separate dashboard formulas created by each department.
The processed result then lands in a queryable store. A dashboard, alerting service, reporting workflow, or AI assistant can read that current-state representation. The visible chart is the final step, not the pipeline itself.
The shortcuts become liabilities
Small teams often cut corners at the boundaries. They accept source changes without a contract, treat late events as impossible, and assume a replay or historical backfill will be easy. Those decisions can appear harmless until a field changes, a payment arrives out of order, or an outage requires reconstruction.
A good data contract makes the expectations explicit between the source and its consumers. It doesn't prevent every failure. It makes failures visible, attributable, and less likely to become a silent disagreement between finance and operations.
Streaming vs Batch and When Each One Wins
This isn't an engineering contest. A 20 to 200 person company should choose the architecture that matches the decision, the operating capacity, and the cost of stale information.
Batch is enough for weekly board reporting, monthly cohort analysis, most finance close work, and metrics that inform planning rather than immediate intervention. Streaming earns its complexity when a person or system must respond within seconds or minutes. Fraud holds, abandoned-cart recovery, capacity alerts, and live usage controls meet that standard.
| Criterion | Batch Is Enough | Streaming Earns Its Cost |
|---|---|---|
| Decision latency | The decision can wait for a scheduled refresh or periodic review | A delay can cause a missed intervention, blocked transaction, or operational incident |
| Data volume and event rate | Events arrive at a manageable pace and aggregate reporting is sufficient | Continuous events need processing before a later job can act on them |
| Team capacity | The company can operate a simpler pipeline with clear reconciliation | The business can support monitoring, replay, incident response, and ownership |
| Cost of stale data | A delayed metric changes no action today | Stale data creates direct operational exposure or lost customer intent |
Use the missed-event test
Ask one question: if an event were unavailable until tomorrow, would anyone change today's action? If the answer is no, batch is fine. If the answer is yes, identify the exact action, owner, and acceptable delay before discussing technology.
Many teams adopt streaming because it signals modernity. That reverses the decision. Streaming introduces always-on infrastructure, more operational states, and more complex failure handling. It should be purchased as a solution to a specific business constraint, not as a status upgrade for the data stack.
Match the pipeline to the operating rhythm
Finance may need a reconciled close, not a live estimate. A COO may need an alert when order volume, service capacity, or payment failures move outside an acceptable range. Product may need current usage when an onboarding intervention can still change activation.
The correct answer can be mixed. Keep financial truth and historical analysis on batch while streaming only the operational signal that needs immediate attention. This avoids turning every metric into a live system when only one decision requires it.
Where Streaming Data Pays Off in SaaS and E-Commerce
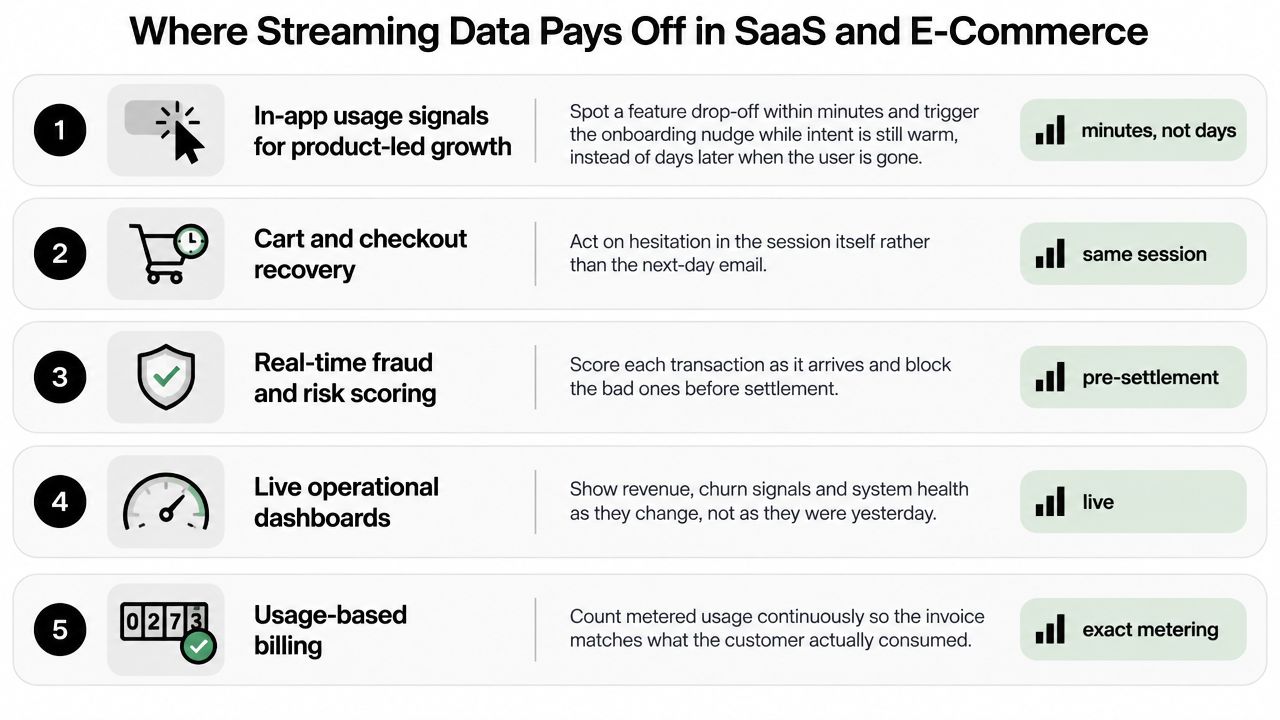
Streaming pays off when it connects an event to an action before the opportunity disappears. The value isn't a prettier dashboard. It's a shorter path between a measurable change and an accountable response.
Product-led growth
A product team can detect that a new user stopped using a core feature and trigger an onboarding prompt while the session or intent is still active. The relevant operator metric is not dashboard freshness by itself. It's activation, feature adoption, and the ability to intervene before the account becomes inactive.
Waiting several hours may turn a recoverable drop-off into a lost trial. Streaming earns its place when the nudge, message, or human follow-up depends on current behavior.
Fraud and abuse
Payment risk, card testing, promotion scraping, and account takeover patterns develop across events. A live scoring flow lets a company hold or challenge a transaction before settlement or before an attacker scales the abuse.
The decision is clear: approve, review, or block. A next-day report helps investigation, but it doesn't protect the transaction that already passed.
Inventory and pricing
E-commerce operators can use current sales, stock, and external market signals to adjust pricing or issue a back-in-stock notification while demand remains relevant. The tracked outcomes include sell-through, stock availability, margin, and conversion.
A stale inventory view can create overselling, delayed replenishment, or a missed purchase. Streaming is justified when the commercial response must occur during the same operating window as the change.
Operational alerting
A live operational view can combine revenue events, error rates, capacity signals, and payment failures. The on-call team receives a targeted alert instead of discovering the issue in a morning review.
This use case works only when alerts have owners and response rules. A real-time feed that generates unreviewed notifications becomes another noisy dashboard.
Customer success intervention
A sudden usage collapse on a strategically important account can trigger same-day investigation. The useful metric may be active seats, core workflow usage, support volume, or a decline in successful transactions.
Customer success doesn't need every account metric to stream. It needs a reliable signal for the accounts where a timely conversation can protect retention or expansion.
The strongest use cases share a pattern. An event arrives, a metric changes, an owner receives a signal, and the owner can still do something useful. Remove the action and streaming becomes expensive observability.
Streaming Data and the Rise of AI-Answerable Metrics
AI assistants can answer plain-English questions only when the underlying metrics are current, defined, and traceable. “What changed in trial-to-paid this week?” requires more than a recent table. It requires consistent treatment of trials, conversions, cancellations, account identity, and time windows.
Streaming helps with the interval between an event and a metric. It can keep a current representation of customer activity, revenue events, or operational state available for questions and decisions. That matters when an agent needs to explain a change that happened recently rather than summarize an old snapshot.
But streaming doesn't make an AI answer trustworthy by itself. A live pipeline can deliver a wrong definition with impressive speed. The semantic layer still needs ownership, consistent business logic, and enough lineage for an operator to investigate an answer that looks off.
Three conditions matter
- Freshness: The event must reach the metric before the answer becomes obsolete.
- Consistency: The same definition must survive dashboard queries, reports, and natural-language questions.
- Lineage: An operator must be able to trace the answer back to source events and transformation rules.
The strategic shift is from live dashboards to AI-answerable metrics. Industry discussion now places streaming alongside concerns such as zero data loss, regional deployments, real-time analytics within the stream, and support for agentic AI. Confluent's 2026 report, as summarized by IBM, says 90% of organizations see streaming as a way to accelerate AI adoption by addressing access, quality, and governance problems in the data supply chain, according to IBM's overview of streaming data.
That figure is a market signal, not a reason to stream every table. An AI that answers from yesterday's stale snapshot can mislead. An AI that answers from a live but poorly governed metric can mislead faster and with more confidence. The genuine prize is trusted, explainable business context, and streaming is one possible part of that foundation.
Trade-Offs and Best Practices Before You Build
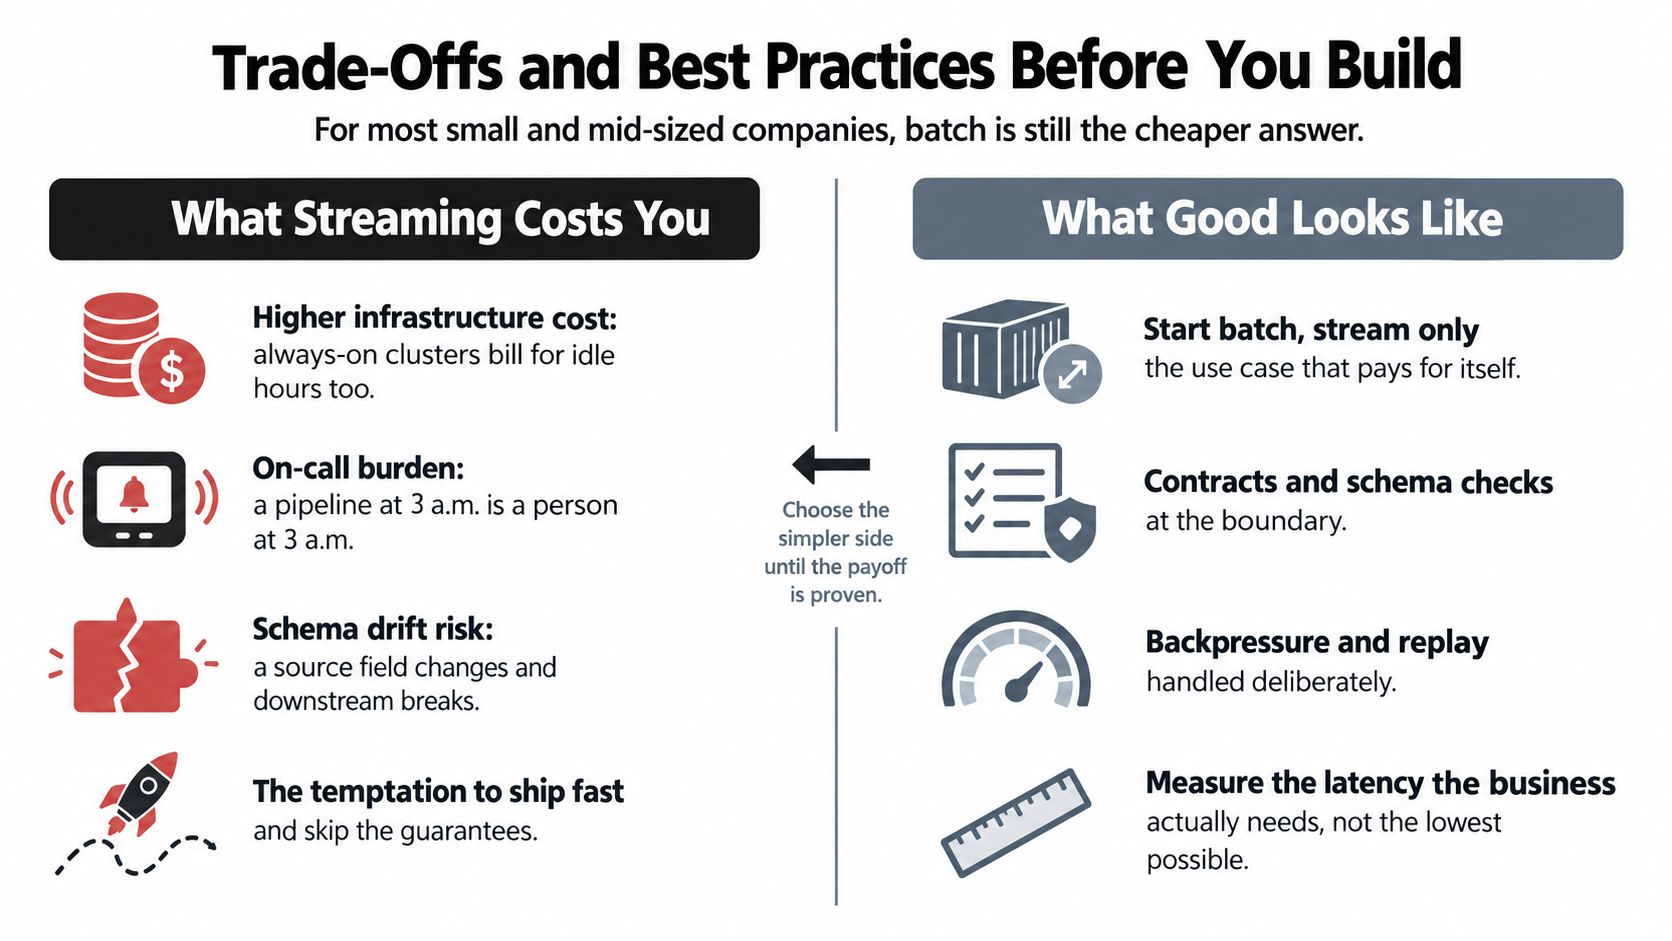
Most small and mid-sized companies shouldn't default to streaming. The costs aren't limited to infrastructure. Someone must monitor lag, investigate duplicates, handle schema changes, replay failed events, and explain why the live number differs from the reconciled financial record.
The core engineering tradeoff is latency versus throughput. Streaming systems aim to process events in seconds or milliseconds, while batch pipelines may take minutes, hours, or days. Rising latency can indicate bottlenecks or insufficient resources, so an operator should monitor not only freshness but also whether the pipeline continues to handle its event load, as explained in this guide to real-time analytics with streaming data.
The quality risks are more serious than the speed gains
Streaming data can contain gaps, errors, inconsistencies, and out-of-order events. A missing event doesn't always announce an outage. It may result from network issues, sparse signals, or a source that failed to emit the expected record.
Watermarks help event-time systems reason about late data. A watermark acts as a lower bound on unseen event timestamps, allowing the system to treat earlier records as complete while acknowledging that late arrivals can still require corrections. More aggressive handling improves freshness but raises the risk of revisions, while slower handling improves confidence at the cost of delayed reporting, as described in this research on watermarks.
The best practices are operational, not fashionable:
- Start with one revenue-touching decision: Prove that current information changes an outcome before expanding the scope.
- Define freshness in business terms: Say “the growth team can act during the customer session,” not “the pipeline has low latency.”
- Separate late data from missing data: A late event may correct a metric. A missing event may indicate a source or completeness problem.
- Keep batch reconciliation: Use the system of record and scheduled checks to audit the live view.
- Set ownership before launch: Someone must own metric definitions, incidents, and exceptions.
Operator advice: Buy streaming to resolve a specific conflict between dashboards or to protect a time-sensitive action. Don't buy it because a vendor demo looked fast.
A service such as HelpWithMetrics can sit at the decision and metric layer for companies that need trustworthy dashboards and plain-English access without building a dedicated data operation. The important evaluation criterion is not whether the provider uses streaming everywhere. It's whether the resulting numbers are governed, explainable, and aligned with the actions your team takes.
FAQ on Streaming Data for Operators
Does streaming cost more than a nightly batch job?
Usually, it creates more operating responsibility because the pipeline runs continuously and needs monitoring, recovery, and replay handling. The cost difference depends on event volume, architecture, retention, query needs, and the level of support required. Compare the total ownership burden, not only the infrastructure invoice.
How long does a first streaming project take without data engineers?
There isn't a universal timeline. It depends on source quality, metric complexity, identity matching, access to systems, and the number of decisions in scope. A narrow operational signal is materially easier to govern than a company-wide real-time model. Start with one decision and a clear acceptance test rather than promising a broad transformation.
Does streaming replace the data warehouse?
No. Streaming usually sits alongside a warehouse or analytical store. The live path serves current operational views, while the warehouse remains valuable for historical analysis, reconciliation, finance, cohorts, and governed reporting.
What happens when events arrive late or out of order?
The system needs explicit event-time rules, correction behavior, and visibility into completeness. Watermarks can help determine when a window is considered sufficiently complete, but they don't eliminate late data. Your dashboard should make revisions and missing signals understandable instead of presenting every number as final.
How do we know when a metric is ready to move from batch to live?
Move it when three conditions are true: a delayed value causes a concrete business cost, an owner can act on the current signal, and the metric has a stable definition that can be reconciled to a system of record. If nobody would change today's decision after a missed event, keep the metric on batch.
HelpWithMetrics helps companies without a data team turn fragmented operational data into governed dashboards and AI-answerable metrics, including live views where the decision requires them. Visit HelpWithMetrics to book a call and get a free first dashboard built around a metric your team currently can't trust.