Year-over-year growth compares a metric with the same period one year earlier, using the formula (Current - Prior Year) / Prior Year × 100. If revenue moves from 100 to 125, YoY growth is 25%, while a move from 100 to 150 produces 50%.
A founder often discovers the problem during board preparation. The finance dashboard says revenue is up, the CRM shows a different growth rate, and the billing system produces a third number. Monthly results look strong, but the board asks one simple question: “What's the year-over-year growth?”
That question sounds straightforward until everyone starts defining revenue differently. One team may include expansions and exclude credits. Another may use recognized revenue, while a third reports bookings or new ARR. The arithmetic is easy. Agreement on what the arithmetic measures is the hard part.
Table of Contents
- Introduction Why Year Over Year Growth Still Matters
- What Year Over Year Growth Really Means
- The YoY Formula and How to Calculate It Correctly
- YoY Versus Other Growth Metrics You Will See
- When YoY Misleads and What to Check Instead
- How to Visualize and Report YoY So Leaders Trust It
- Getting One Trusted YoY Number With HelpWithMetrics
Introduction Why Year Over Year Growth Still Matters
In December, a SaaS company runs a promotion that pulls $40K of January renewals into the prior month. December revenue jumps, then January falls. A month-over-month dashboard can frame the first result as momentum and the second as a warning, even though the promotion changed the timing rather than the underlying demand.
YoY gives leaders a cleaner annual comparison. It places the current period beside the same calendar slice from the previous year, helping separate structural change from predictable seasonal movement. South Australia's Department of Treasury and Finance defines YoY as the latest month or quarter compared with the same month or quarter in the prior year, and applies the same logic to annual comparisons across four-quarter periods in its official economic glossary.
The December example still needs judgment. If the company's fourth quarter is normally strong, comparing December with November mostly measures the calendar. Comparing December with the previous December asks a more useful question: did the business perform better during the same seasonal window?
Operator's view: YoY is useful because it normalizes the calendar. It becomes dangerous when leaders assume that a normalized comparison is automatically a fair comparison.
A trusted rate depends on more than the formula. Founders need to know which revenue definition produced it, whether pricing or the customer mix changed, and whether the comparison period was unusually weak. The CRM, billing platform, finance system, and board deck must apply the same governed definition, or one company can produce several defensible-looking YoY figures.
That makes YoY a trust problem as much as a measurement problem. A shared culture of data gives teams common metric language and clearer ownership, so board discussions focus on decisions instead of reconciliation.
This article explains the meaning and calculation of YoY, compares it with other growth metrics, examines when it misleads, and shows how a governed semantic layer helps leaders use one credible number.
What Year Over Year Growth Really Means
Start with a calendar, not a calculator.
A retailer's December sales naturally behave differently from sales in a quieter month. A SaaS company may close more contracts in a particular quarter because procurement budgets, renewal cycles, or annual planning create recurring patterns. Comparing December with the previous December, or Q2 with the previous Q2, holds the seasonal position more constant.
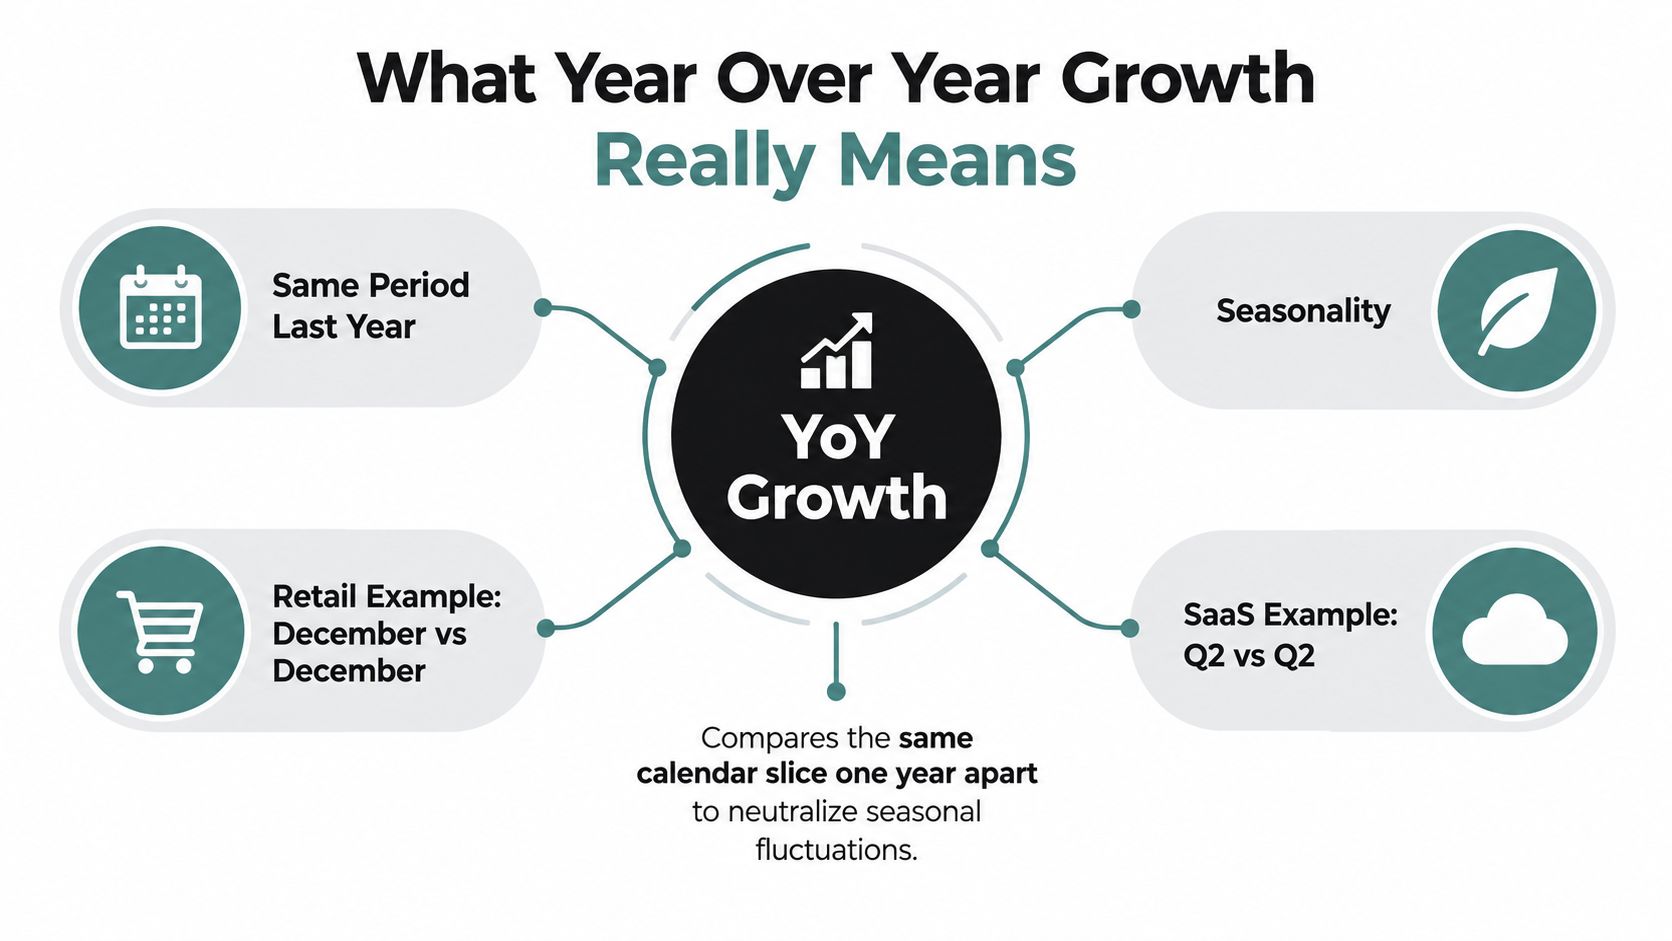
The comparison produces a rate, not just a raw difference. If revenue rises by 25 units, that increase means something different for a business whose prior-year revenue was 100 than for one whose prior-year revenue was 1,000. YoY expresses the change relative to the prior-year baseline, which makes periods easier to compare.
Year-over-year growth compares the latest period with the same period in the previous year.
The formal logic is simple:
- Current period: The metric you're evaluating now.
- Prior-year period: The same calendar period one year earlier.
- Growth rate: The change divided by the prior-year value.
For annual reporting, official statistical usage can compare the latest four quarters with the previous four quarters. The South Australia glossary also identifies year-ended growth and year on year as interchangeable labels commonly used for this type of comparison. In business reporting, you'll often see YoY used for revenue, customer count, churn, bookings, traffic, or operating costs.
The phrase “same period” matters more than many definitions admit. A quarterly comparison should use a comparable quarter. A monthly comparison should use the same month. A rolling twelve-month figure needs a clearly documented window, not an arbitrary selection that makes the result look favorable.
YoY also doesn't mean the business improved in every underlying dimension. Revenue can increase while retention weakens, collections slow, or sales efficiency deteriorates. The rate answers one question, whether the selected metric changed relative to the comparable prior-year period. It doesn't explain why the change occurred or whether it will continue.
The YoY Formula and How to Calculate It Correctly
The arithmetic is simple. The harder problem is agreeing on what the arithmetic measures. If one dashboard uses gross bookings and another uses net revenue, both can calculate YoY correctly while showing different results. A governed semantic layer fixes that trust problem by defining the metric once, then applying the same definition to every report.
The standard formula is:
YoY growth = (Current Period Value - Prior-Year Same Period Value) / Prior-Year Same Period Value × 100
You can also express it as:
YoY growth = (Current ÷ Prior-Year) - 1
The second version produces a decimal before conversion to a percentage. Both formulas describe the same relationship when the current period and prior-year period use identical metric definitions, filters, and time windows.
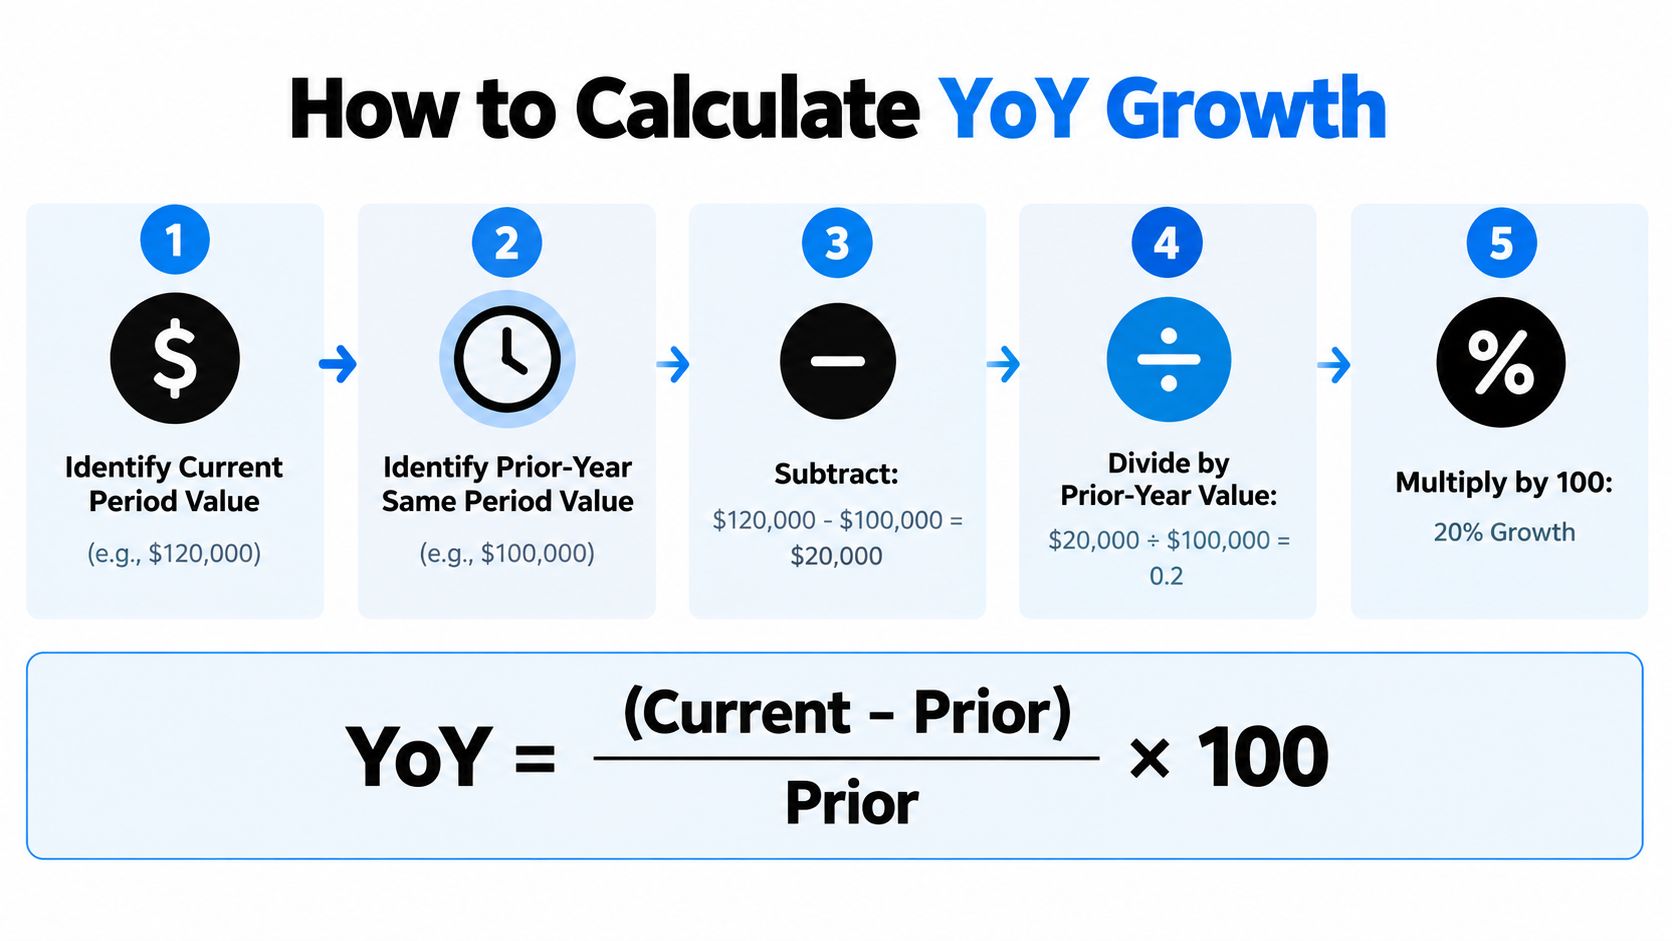
Take a simple monthly revenue example. If prior-year revenue was 100 and current revenue is 125, the change is 25. Dividing 25 by 100 produces 0.25, or 25% YoY growth. If current revenue is 150 against the same prior-year value of 100, the result is 50% YoY growth.
A larger value does not change the logic. If prior-year revenue was 1,000 and current revenue is 1,250, the increase is 250. Dividing 250 by 1,000 produces 25% growth. If current revenue is 750, the change is negative 250, producing -25% YoY growth, as explained in this finance explanation of the YoY formula.
In a board meeting, translate the result into plain English:
- Positive YoY: The metric is higher than the same period last year.
- Zero YoY: The metric is unchanged from the comparison period.
- Negative YoY: The metric is lower than the same period last year.
A negative result may reflect deliberate customer pruning, fewer low-margin sales, or a planned acquisition shift. A positive result may still hide weaker retention or slower collections. Pair the rate with absolute values and the operating drivers behind it.
Zero baselines need separate treatment. If the prior-year value is zero, division by zero cannot produce a meaningful percentage. Report the absolute change and describe the new activity instead of forcing a growth rate.
Revenue also needs a precise definition. A net revenue calculation may include discounts, refunds, credits, and other adjustments that a bookings report excludes. If the numerator and denominator use different definitions, the result can be mathematically correct but operationally meaningless.
YoY Versus Other Growth Metrics You Will See
YoY is one lens, not the entire dashboard.
Month-over-month, or MoM, compares adjacent months. It reacts quickly to changes in pricing, demand, hiring, or conversion, but it can be noisy when the business has strong seasonal patterns. Quarter-over-quarter, or QoQ, serves a similar purpose at a broader interval. It can reveal recent momentum without waiting for a full annual comparison.
CAGR, or compound annual growth rate, answers a different question. It smooths growth across multiple years to show the implied compounding pace over a longer span. That makes it useful for strategic planning, but it can hide the uneven path between the starting point and the ending point.
| Metric | Best Use Case | Handles Seasonality | Watch Out For |
|---|---|---|---|
| YoY | Comparing the current period with the same period last year | Better than adjacent-period comparisons | A distorted baseline or changed business mix |
| MoM | Monitoring immediate operating momentum | Poorly, unless adjusted for recurring patterns | Calendar effects, promotions, and short-term volatility |
| QoQ | Reviewing recent quarterly movement | Partially | Contract timing, quarter-end deals, and uneven sales cycles |
| CAGR | Summarizing long-term compounded growth | Smooths the full span | Hiding slowdowns, reversals, or sharp swings inside the period |
A board usually wants YoY because it offers a clean annual benchmark. Investors and directors can understand whether revenue, customers, or another headline measure is larger than it was during the comparable period. That doesn't make YoY sufficient for operating decisions.
A VP of Sales may care more about current pipeline creation and QoQ bookings. A finance leader may focus on collections and cash conversion. A product leader may watch activation and retention over shorter windows. Each metric has a job, and forcing every decision through YoY creates delay.
The strongest reporting stack shows the lenses together without confusing them. Put the annual comparison beside a recent trend, then state the business definition for each metric. A dashboard that displays YoY, MoM, and CAGR without explaining their purpose gives readers more numbers but less clarity.
Use YoY to understand annual health, MoM or QoQ to detect current movement, and CAGR to describe the long-term arc. The mistake isn't choosing one. The mistake is treating them as interchangeable.
When YoY Misleads and What to Check Instead
A strong YoY result can tell the wrong story.
Suppose a founder reports that revenue is up 18% YoY, while pipeline quality, retention, and cash collection all feel worse. The contradiction may be real. YoY measures the selected revenue line against its prior-year baseline. It doesn't guarantee that the baseline was normal or that the rest of the business moved in the same direction.
A depressed prior-year period can inflate the current rate. If the previous year included a lost customer, supply disruption, unusually low demand, or a temporary operational failure, the comparison may celebrate recovery as if it were ongoing expansion. The analysis of YoY interpretation risks highlights this broader problem, especially when the business has changed shape between the two periods.
Four questions behind the headline rate
Was the baseline comparable? Check whether the prior-year period included unusual discounts, supply constraints, one-off contracts, or reporting changes. A percentage can look impressive because the denominator was weak.
Did pricing change? Higher prices can lift revenue while units, usage, or customer value decline. Pair revenue YoY with volume, average contract value, gross margin, and retention where those measures matter.
Did acquisition mix shift? New customers from a different channel may have different conversion, expansion, or churn behavior. Segment the result by cohort and source instead of treating all new revenue as equivalent.
Did the period length and definition match? Confirm that both periods cover the same calendar duration and use the same revenue, customer, or ARR definition. A CRM report based on new ARR shouldn't be compared with recognized revenue because both are labeled growth.
The deeper issue is structural change. A company that acquired another business, changed packaging, moved upmarket, or exited a customer segment may no longer have a clean like-for-like comparison. The metric can still be calculated, but the interpretation needs a qualification.
A headline rate describes what changed. It doesn't prove that the operating model improved.
Use absolute values, cohort views, recent-period trends, and unit economics to test the story. If YoY is rising while those indicators weaken, leadership shouldn't dismiss the tension. It should investigate which part of the business is carrying the reported growth.
How to Visualize and Report YoY So Leaders Trust It
Trust begins with context on the chart.
A large percentage without the underlying values invites misinterpretation. Show the current value, the prior-year value, and the resulting rate together. A leader should be able to see both the size of the business and the relative change without opening a spreadsheet.
Use period labels that remove ambiguity. “Q2 YoY” is more useful than “growth” because it identifies the comparison window. Monthly charts should make clear whether every month is compared with the same month in the previous year. If a metric uses a rolling period, label that window explicitly.
Annotate events that affect interpretation. A pricing change, acquisition, product launch, contract termination, or supply issue belongs in the chart context. The annotation doesn't alter the number. It helps the reader understand why the number moved.
A dependable report should also avoid selective windows. If the dashboard highlights only the strongest period, leaders can't distinguish a durable pattern from a favorable snapshot. Show the broader history and make the chosen comparison consistent across reporting cycles.
Governance matters more than decoration
The most important reporting decision is the metric contract. Finance, sales, marketing, and customer success need one agreed definition for revenue, customers, churn, ARR, and other board-level measures. That definition should identify the source, inclusion rules, exclusions, time zone or period boundary, and owner.
The need for context appears in public reporting as well. Taiwan's GDP was reported at 6.7% YoY in the first half of 2025, while IATA reported global air passenger RPK growth of 5.7% YoY in November 2025. Those figures are meaningful only because the reports identify the measure and comparison period, as discussed in the YoY metrics overview.
For a practical dashboard reference, the Bookkeeping and Accounting of Florida Inc dashboard provides useful context on presenting business performance metrics in a centralized view. Internally, the same principle applies: one visual layer should not conceal competing definitions underneath.
Teams should also follow dashboard design best practices so visual hierarchy supports the decision. Put the annual rate beside the values, show the trend, document exceptions, and make the underlying definition easy to find.
Getting One Trusted YoY Number With HelpWithMetrics
The recurring YoY dispute is rarely a math problem. It's a semantic problem.
The CRM may define a new customer by opportunity stage. Billing may define revenue by invoice or subscription event. Finance may report recognized revenue after adjustments. Each system can be internally consistent and still disagree with the others.
A governed semantic layer resolves that conflict at the meaning level. It gives the business one shared definition for each metric, maps that definition to the relevant systems, and preserves the logic needed to explain how a number was produced. The result isn't just a cleaner dashboard. It's an auditable answer to questions such as, “Why is revenue growth different from the number in the sales report?”
Agentic BI adds a natural-language interface on top of that governed foundation. A founder can ask for YoY revenue by segment, a COO can request the current trend beside the prior-year comparison, and a RevOps leader can ask which cohorts explain the movement. The system can return a chart or explanation that follows the agreed metric definitions, rather than improvising from whichever table happens to be available.
That architecture matters for companies without a data team. Hiring internally can take time, and a new analyst may still inherit undocumented definitions, disconnected tools, and unclear ownership. A done-for-you model focuses on producing trustworthy metrics and AI-answerable data without requiring the company to build the entire reporting function first.
The objective is simple: when the board asks for YoY growth, everyone sees the same number, understands what it measures, and can connect it to the operating decisions that follow.
HelpWithMetrics connects your business systems into a governed reporting layer, so YoY and other core metrics stay consistent across finance, CRM, and dashboards. Visit HelpWithMetrics to book a call and get a free first dashboard built around the numbers your leadership team needs.